 PluginStats
Build Web Data Visualization listing history
By OpenAI (35 listings) · ChatGPT Plugins · Developer Tools
Design, build, test, and export web data visualizations
ChatGPT Plugins does not publish install or usage counts, so PluginStats tracks Build Web Data Visualization's listing placement instead.
It currently appears at position #1150 in the marketplace's popularity-sorted listing.
Category positions: #53 in Developer Tools
About Build Web Data Visualization
Use Build Web Data Visualization to choose, design, implement, test, and export browser charts, dashboards, maps, WebGL/Three.js scenes, Canvas/D3 visuals, Gantt charts, UML/software diagrams, scrollytelling, reports, PDFs, and slide decks. It emphasizes source-backed data, accessible responsive layouts, URL-shareable analysis state, and concept-first design for advanced visual stories.
Description from the ChatGPT Plugins listing.
- Interactive
- Read
- Write
Charts
Images: 30d · 1y · all time · 1600×900 dark
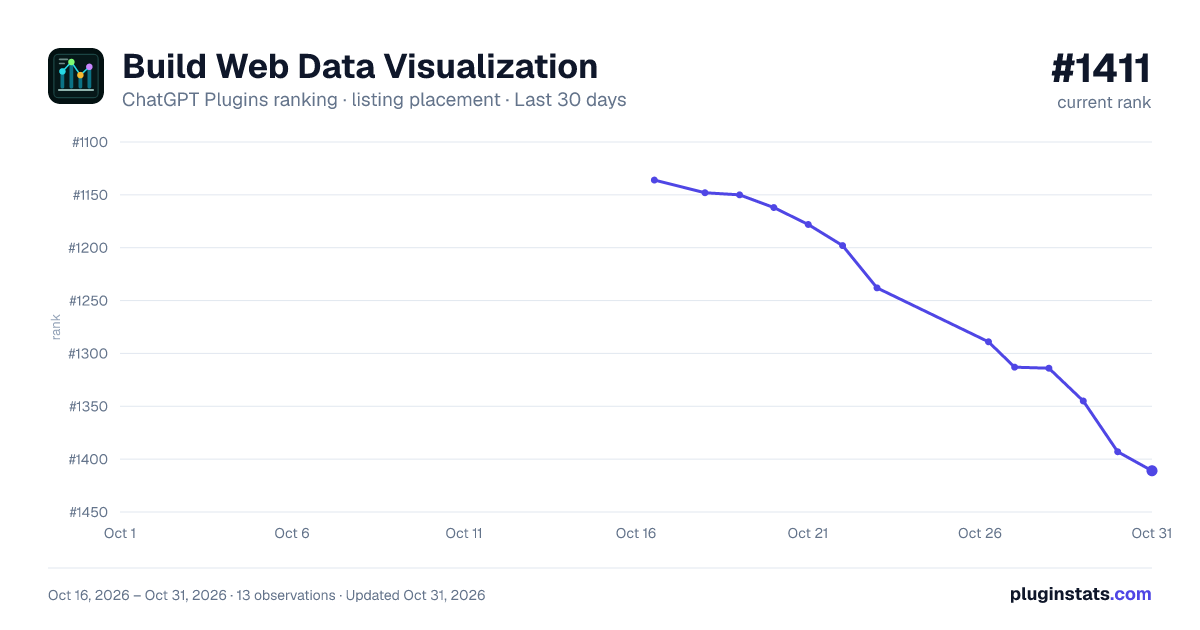
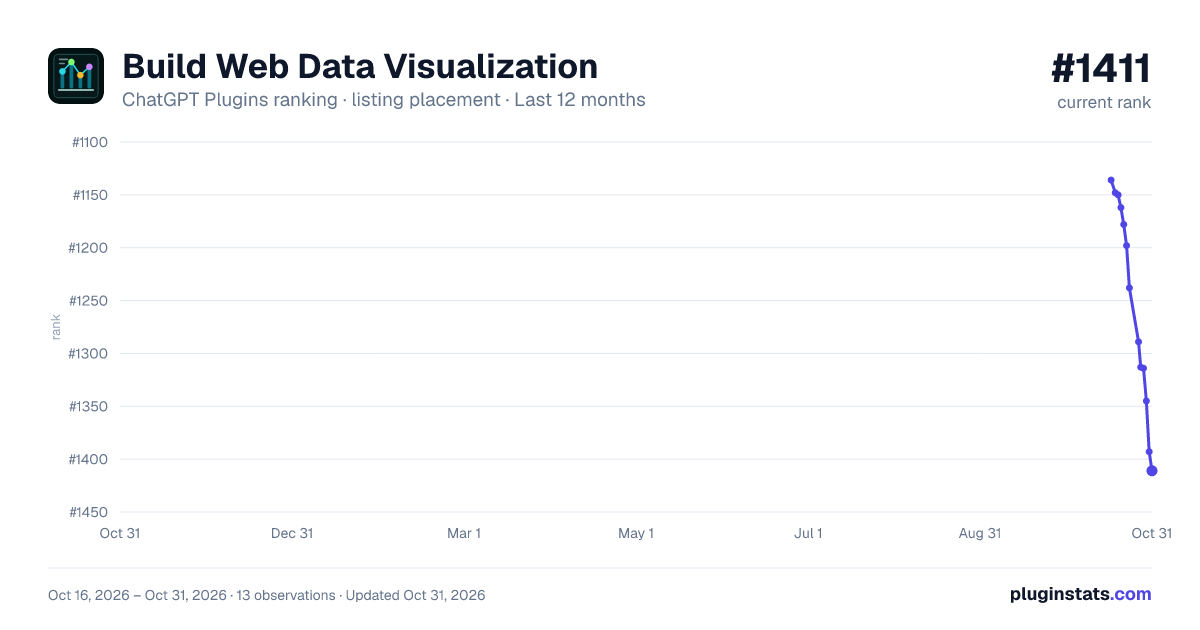
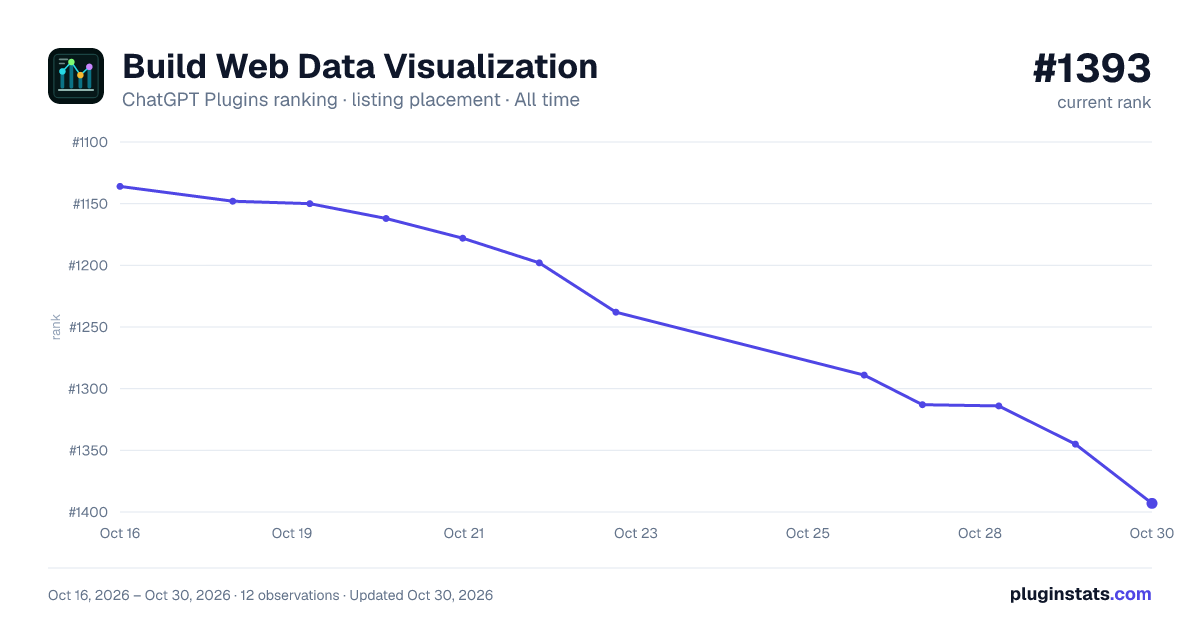


Filled points are observed values; hollow points come from Internet Archive snapshots of the listing page. Dashed segments span periods with no observations — values between points are not interpolated.
Similar ChatGPT Plugins Developer Tools plugins
Data source
OpenAI does not publish install counts or ratings for ChatGPT plugins. PluginStats records listing details and each plugin's placement in the directory over time: overall position follows the Popular list, then New & Noteworthy, then each category in directory order.
Listing: https://chatgpt.com/plugins/Plugin_40dab999fe9c8191bbc2f550371692fc. First seen Oct 16, 2026; last successful collection Oct 19, 2026. See the methodology.