 PluginStats

Visual Debugger downloads statistics
By Tim Kräuter · JetBrains Marketplace · Debugging
This plugin visualizes the variables during a debugging session as a UML object diagram. The plugin is used alongside normal debugging. Set a breakpoint for debugging...
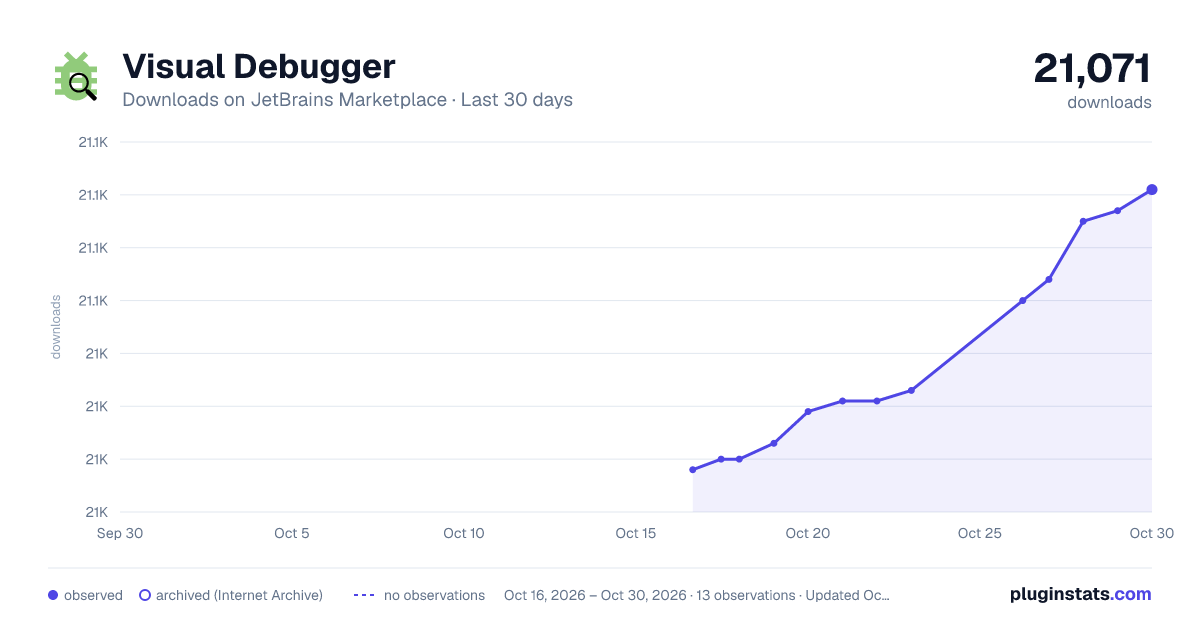
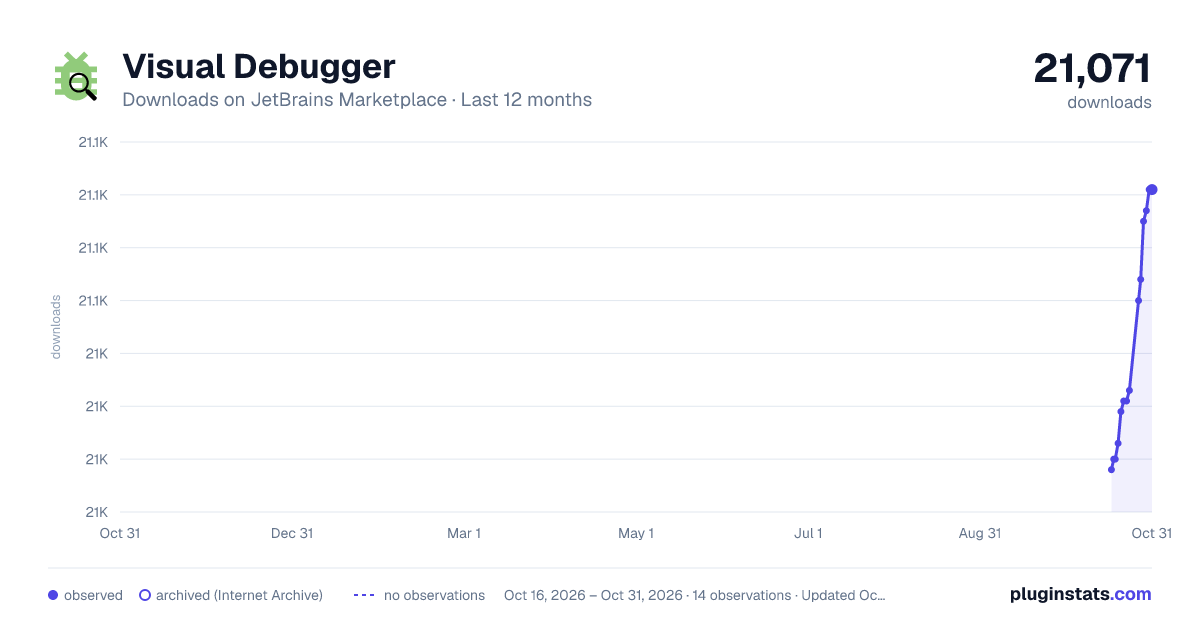
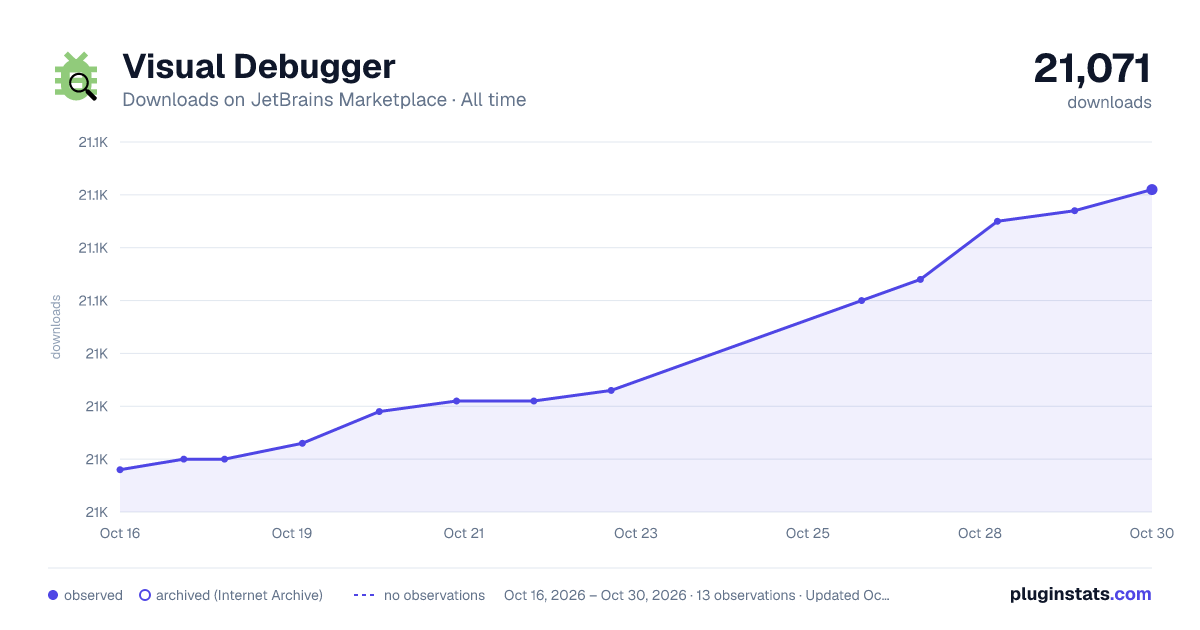
Visual Debugger has 21,020 recorded downloads on JetBrains Marketplace.
It ranks #2095 of 2,500 tracked JetBrains Marketplace listings by downloads.
It is rated 5.0 out of 5 from 4 ratings.
PluginStats has 3 daily observations since Oct 16, 2026; the latest is from Oct 18, 2026.
Rating: 5.00 / 5 from 4 ratings
About Visual Debugger
This plugin visualizes the variables during a debugging session as a UML object diagram. The plugin is used alongside normal debugging. Set a breakpoint for debugging and start the debugging as usual in the IDE. The plugin will automatically create a visual debugging toolbar in the debug window, shown in the screenshot. All variables in the scope of a debugging session will be visualized as an object diagram.
The default visualization is browser-based and allows double click on objects to load its children directly from the UI. In addition, there is an embedded visualization using PlantUML, which does not support user interaction.
By default, the plugin will visualize objects up to a depth of 3, but this is configurable using the plugin settings. The browser UI allows the user to download the current object diagram as an SVG- or XML-File for future discussion. Printing an SVG-File when using the embedded visualization can be done from the IDE using the print icon in the plugin toolbar.
Description from the JetBrains Marketplace listing.
- Debugging
- Notification and Visualizers
Where Visual Debugger sits in the listing
Each band is one page of 20. Downloads on a log scale. Placement is projected from downloads, so it can differ from the marketplace's own sort order. Hover a dot to see the listing.
Charts
Images: 30d · 1y · all time · 1600×900 dark
Adoption over time
7/30/90-day growth
Ranking history
Filled points are observed values; hollow points come from Internet Archive snapshots of the listing page. Dashed segments span periods with no observations — values between points are not interpolated.
Recent observations
Full history (3)Similar JetBrains Marketplace Debugging plugins




Data source
Cumulative download counts come from the public JetBrains Marketplace API. JetBrains reports downloads, not active installs. Ratings are the mean of public votes.
Listing: https://plugins.jetbrains.com/plugin/16851-visual-debugger. First seen Oct 16, 2026; last successful collection Oct 18, 2026. See the methodology.