 PluginStats

Spring Debugger downloads statistics
By JetBrains s.r.o. (640 listings) · JetBrains Marketplace · Debugging
The Spring Debugger plugin for IntelliJ IDEA gives you instant insight into your Spring application while debugging. It brings Spring’s complex runtime behavior into...
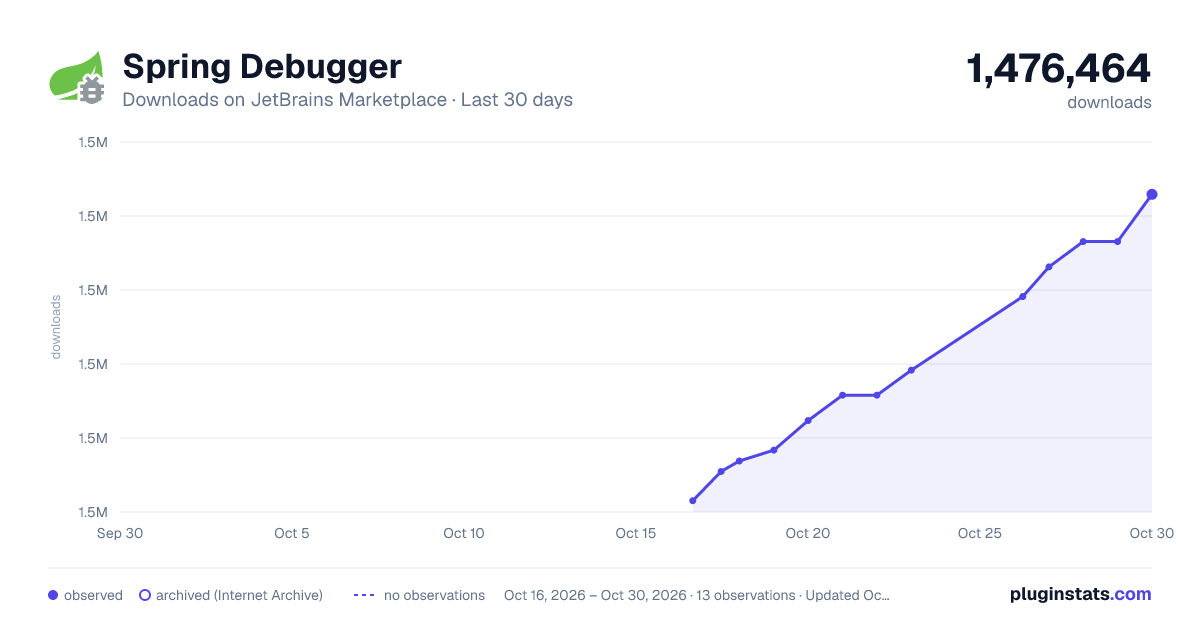
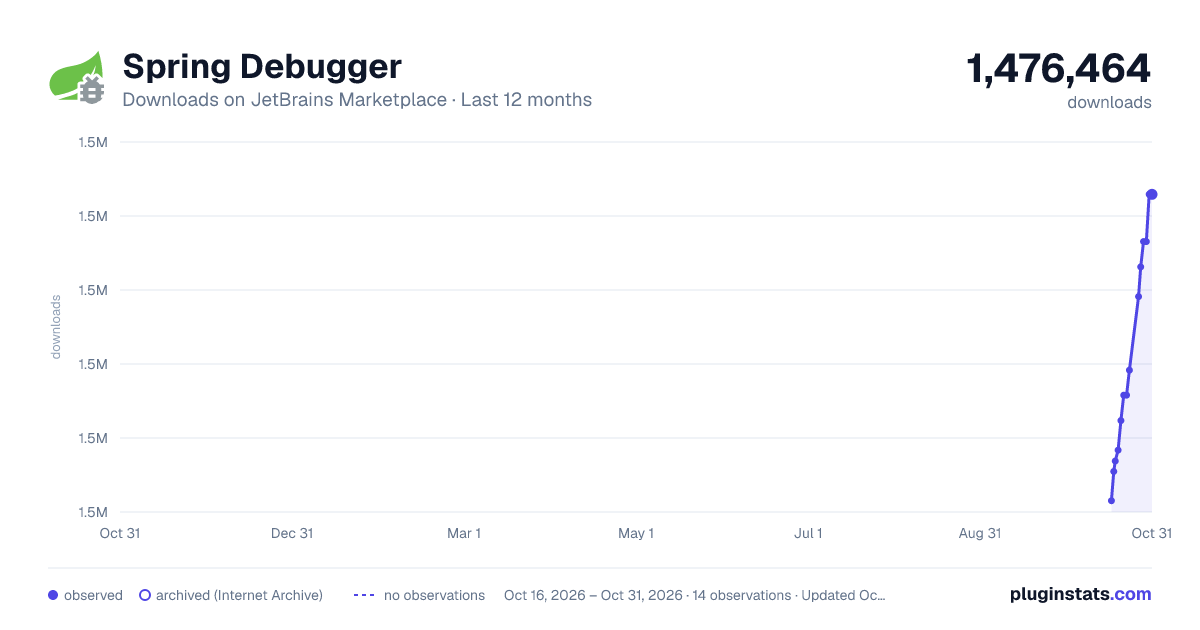
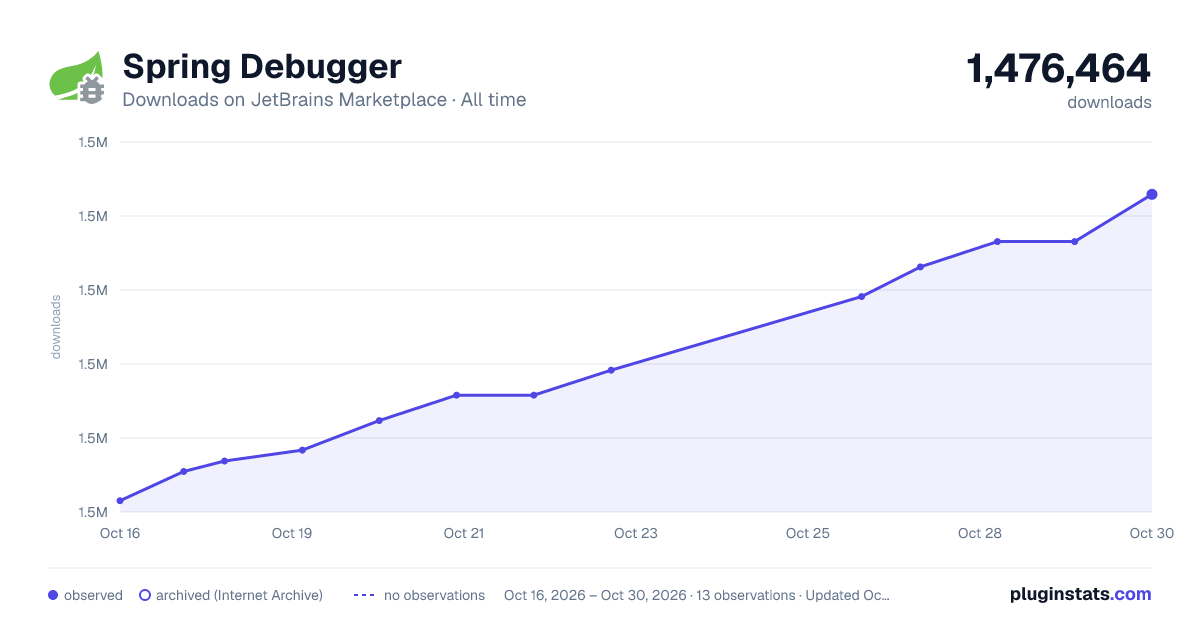
Spring Debugger has 1,459,180 recorded downloads on JetBrains Marketplace.
It ranks #226 of 2,501 tracked JetBrains Marketplace listings by downloads.
It is rated 4.9 out of 5 from 25 ratings.
PluginStats has 4 daily observations since Oct 16, 2026; the latest is from Oct 19, 2026.
Rating: 4.92 / 5 from 25 ratings
About Spring Debugger
The Spring Debugger plugin for IntelliJ IDEA gives you instant insight into your Spring application while debugging. It brings Spring’s complex runtime behavior into focus by integrating seamlessly with IntelliJ IDEA. See how beans are wired, trace configuration values, inspect database connections, and monitor a transaction state—without leaving your IDE.
The Spring Debugger helps you understand what’s going on behind the scenes, so you can resolve issues faster, verify application state, and write high-quality, maintainable code.
Key features:
• Application Context Insight
• Context Visibility: Displays the state and details (name, type, scope) of instantiated Spring beans in the code editor, debugger tool window, and project view during active debug sessions. • Extended Watches: Enhances the standard Watches view with live runtime data for loaded Spring beans. • Direct Bean Method Invocation: Lets you access Spring bean methods and properties directly in the debugger’s expression evaluator.
• Properties & Configuration
• Actual Values Display: Shows the final resolved values of Spring configuration properties directly in the editor. • Property Evaluation in Debugger: Allows you to check property values at runtime using the debugger. • Value Source Tracking: Reveals where each property came from and its final value in the Watches view. • Loaded Configuration Files: Lists the configuration files that contributed to the current environment.
• Data Access & Transactions
• Active DB Connection Display: Automatically shows active database connections, including testcontainers, with no manual setup. • Transaction Status Display: Displays the current status of Spring-managed transactions inside the debugger tool window. • Entity State in Watches: Adds support for viewing JPA entity lifecycle states (e.g., managed, detached) directly in the Watches view.
• Spring Security Support
• Endpoint Security Indicators: Shows inline hints on controller endpoints and HTTP Client requests indicating whether authentication is required and which roles or authorities are needed. • Instant Endpoint Unlocking: Lets you unlock a secured endpoint during a debug session with a default or custom test user, bypassing the real login flow. • Security Configuration Navigation: Jumps directly from the security hint to the bean or class that declares the application's security filter chain.
Description from the JetBrains Marketplace listing.
- Debugging
- Framework
- Productivity
Where Spring Debugger sits in the listing
Each band is one page of 20. Downloads on a log scale. Placement is projected from downloads, so it can differ from the marketplace's own sort order. Hover a dot to see the listing.
Charts
Images: 30d · 1y · all time · 1600×900 dark
Adoption over time
7/30/90-day growth
Ranking history
Filled points are observed values; hollow points come from Internet Archive snapshots of the listing page. Dashed segments span periods with no observations — values between points are not interpolated.
Recent observations
Full history (4)Similar JetBrains Marketplace Debugging plugins




Data source
Cumulative download counts come from the public JetBrains Marketplace API. JetBrains reports downloads, not active installs. Ratings are the mean of public votes.
Listing: https://plugins.jetbrains.com/plugin/25302-spring-debugger. First seen Oct 16, 2026; last successful collection Oct 19, 2026. See the methodology.