 PluginStats

Screener QoQ And YoY Growth Tracker users statistics
Enhanced financial analysis tool for Screener.in - adds Quarter-over-Quarter and Year-over-Year growth metrics
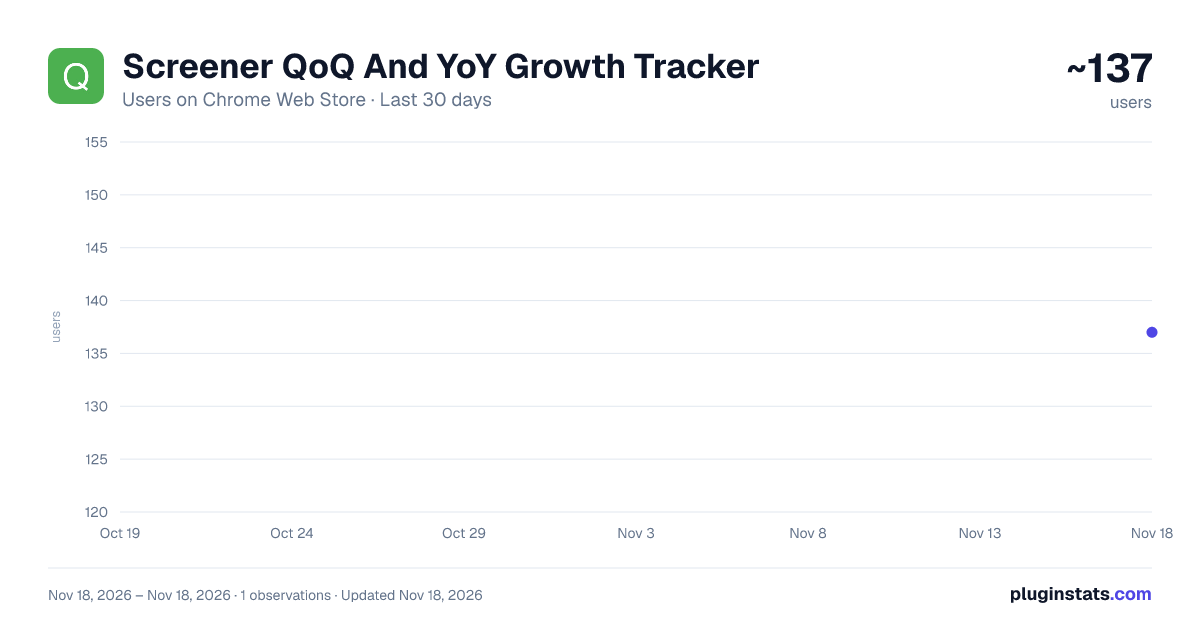
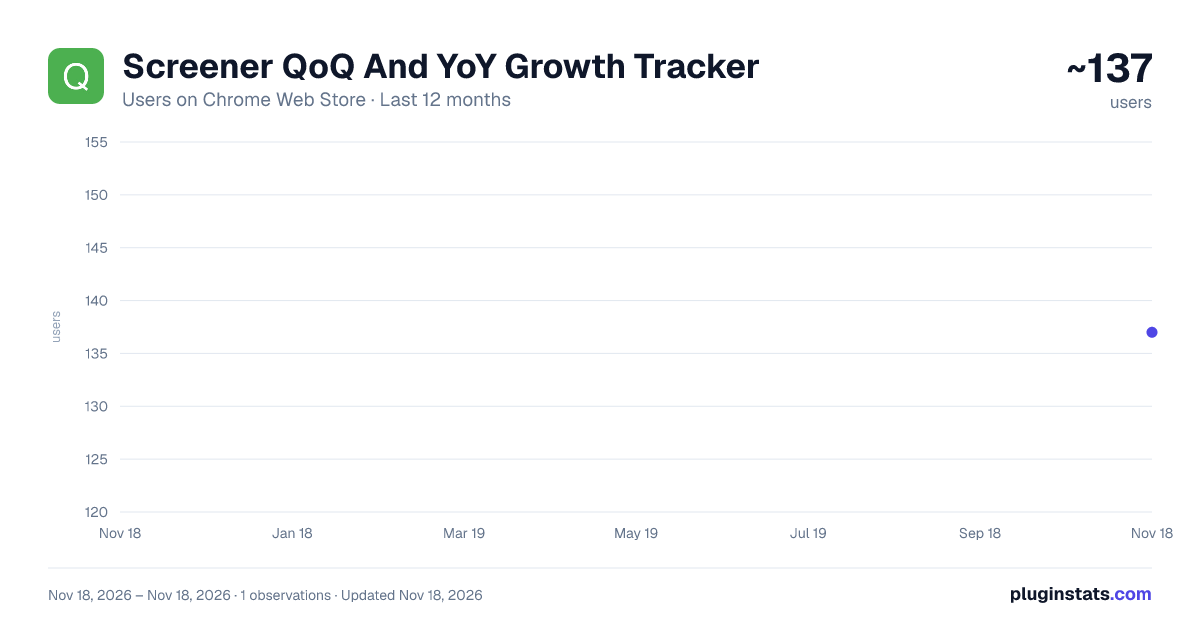
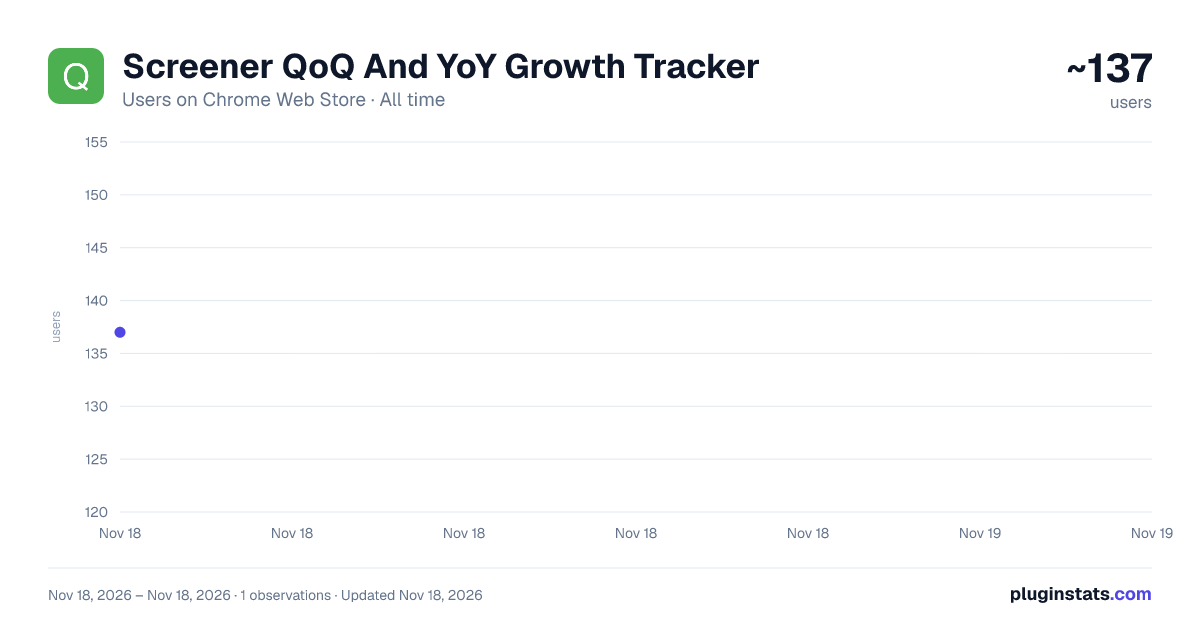
Screener QoQ And YoY Growth Tracker has approximately 137 recorded users on Chrome Web Store, ranking #9219 of 10,523 tracked listings.
Rating: 5.00 / 5 from 1 ratings
About Screener QoQ And YoY Growth Tracker
Enhanced financial analysis tool for Screener.in - adds Quarter-over-Quarter and Year-over-Year growth metrics
🎯 TRANSFORM YOUR SCREENER.IN EXPERIENCE WITH INSTANT GROWTH ANALYSIS
Tired of manually calculating Quarter-over-Quarter and Year-over-Year growth rates while analyzing stocks on Screener.in? This powerful Chrome extension does it automatically, adding professional-grade growth metrics and stunning visualizations right where you need them!
✨ KEY FEATURES THAT SAVE YOU TIME
📊 AUTOMATIC GROWTH CALCULATIONS Every quarter on Screener.in now shows: • QoQ% (Quarter-over-Quarter): Compare each quarter with the previous one • YoY% (Year-over-Year): Compare with the same quarter last year • Instant calculations for Sales, Operating Profit, and all financial metrics • Smart handling of negative values, percentages, and missing data
📈 BEAUTIFUL INTERACTIVE CHARTS (5 Per Company!) Visualize growth trends instantly with professional charts:
SALES ANALYSIS: • QoQ Line Chart - Track quarterly sales momentum over time • QoQ Bar Chart - Visual comparison with color-coded bars • YoY Combined Chart - Long-term view showing Sales + Operating Profit together
OPERATING PROFIT TRACKING: • QoQ Line Chart - Quarterly profitability trends at a glance • QoQ Bar Chart - Instant visual profit comparison
Each chart features: ✓ Responsive design that adapts to your screen ✓ Interactive tooltips showing exact percentages ✓ Clean, professional styling matching Screener.in's look ✓ Smooth animations and intuitive controls
🎨 SMART COLOR-CODED INSIGHTS Never miss a trend with intelligent visual indicators: • 🟢 GREEN points/bars = Value INCREASED from previous period • 🔴 RED points/bars = Value DECREASED from previous period • 📊 Each data point colored based on actual performance • 💡 Instantly spot growth acceleration or deceleration
⚙️ CUSTOMIZABLE & USER-FRIENDLY Complete control at your fingertips: • Toggle ON/OFF with a single click • Customize decimal precision (0-4 decimal places) • Settings persist across browser sessions • Non-intrusive design that enhances, not disrupts • Works seamlessly with Screener.in's existing features
🚀 PERFECT FOR
📈 INVESTORS • Quick screening of quarterly performance across multiple companies • Identify consistent growth patterns without spreadsheets • Spot seasonal trends and business cycles instantly • Make faster, data-driven investment decisions
📊 FINANCIAL ANALYSTS • Eliminate tedious manual calculations • Professional visualizations ready for reports • Comprehensive growth metrics at a glance • Focus on analysis, not data processing
💹 TRADERS • Rapid momentum assessment for short-term positions • Visual confirmation of fundamental trends • Detect accelerating or decelerating growth immediately • Compare multiple companies efficiently
💡 HOW IT WORKS (3 SIMPLE STEPS)
-
INSTALL THE EXTENSION One-click installation from Chrome Web Store - takes 5 seconds!
-
VISIT SCREENER.IN Go to any company page (e.g., Reliance, TCS, Infosys, etc.) Both consolidated and standalone results are supported
-
ANALYZE INSTANTLY • Scroll to "Quarterly Results" section • See QoQ% and YoY% columns automatically added • Charts appear below the table • Start analyzing growth trends immediately!
🔍 SMART FEATURES UNDER THE HOOD
INTELLIGENT DATA DETECTION: • Automatically finds "Sales" row in any table format • Recognizes multiple naming conventions:
- "Operating Profit"
- "Operating Income"
- "Financing Profit"
- "EBIT" • Handles consolidated and standalone results • Works with all Indian and international companies on Screener.in
ROBUST DATA HANDLING: • Parses numbers with commas (1,23,456) • Handles percentages, negative values • Manages "N/A" and missing data gracefully • Supports various number formats
PERFORMANCE OPTIMIZED: • Loads only after page resources are ready • Minimal memory footprint (~250KB including charts) • No lag or slowdown • Efficient DOM manipulation • Smart validation prevents errors
🔒 PRIVACY & SECURITY YOU CAN TRUST
✅ ZERO DATA COLLECTION • No analytics, tracking, or monitoring • Your browsing activity stays private • No personal information collected
✅ LOCAL PROCESSING ONLY • All calculations happen in your browser • No external server requests • No data leaves your device
✅ MINIMAL PERMISSIONS • Runs ONLY on Screener.in domain • Storage used only for your settings • Open source code on GitHub for transparency
✅ NO ADS, NO TRACKING • Completely free, no hidden costs • No advertisements or promotions • Built for the investor community
🎯 REAL-WORLD EXAMPLES
SCENARIO 1: Quick Stock Screening You're researching 10 companies. Instead of opening Excel and calculating growth rates manually for each quarter, you simply browse their Screener.in pages. Each company shows instant QoQ/YoY metrics with visual charts. You complete your screening in 10 minutes instead of an hour!
SCENARIO 2: Identifying Trends You notice a company's sales QoQ chart shows consistent green bars for 8 quarters. The YoY chart confirms 20%+ annual growth. The visual pattern immediately reveals a strong growth story that raw numbers might hide.
SCENARIO 3: Comparative Analysis Comparing two competitors? Open their Screener.in pages in different tabs. The charts make it instantly obvious which company has better growth momentum, seasonal patterns, or profit margin expansion.
⚡ TECHNICAL HIGHLIGHTS
• Built with modern Chrome Extension Manifest V3 • Powered by Chart.js 4.4.0 for professional visualizations • Pure JavaScript - no framework bloat • Responsive CSS for all screen sizes • Compatible with Chrome, Edge, Brave, Opera (Chromium-based) • Regular updates and improvements
🆕 WHAT'S NEW IN VERSION 1.0.0…
Description from the Chrome Web Store listing.
README badge
Show your rank in a README or on your website. The badge updates automatically.
Charts
Images: 30d · 1y · all time · 1600×900 dark
Adoption over time
7/30/90-day growth
Ranking history
Ratings over time
Listing placement
Listing placement
Filled points are observed values; hollow points come from Internet Archive snapshots of the listing page. Dashed segments span periods with no observations — values between points are not interpolated.
Each band is one page of 20. Users on a linear scale. Placement is projected from users, so it can differ from the marketplace's own sort order. Hover a dot to see the listing.
Recent observations
Full history (1)Similar Chrome Web Store Education plugins
All 20 Screener QoQ And YoY Growth Tracker alternatives



Data source
Covers every Chrome Web Store extension with at least 100 users, found through the store's public sitemap. User counts are read from public listing pages. The 10% most-used extensions are refreshed daily, the next 40% weekly and the next 40% monthly; the least-used 10% are not refreshed. Google displays rounded user counts (and caps the display at 10,000,000+), so small changes may not be visible. Rating counts above 1,000 are rounded (e.g. 1.6K).
Listing: https://chromewebstore.google.com/detail/screener-qoq-and-yoy-grow/ofcfhcekblggikmefgjcgkabmikkeknh. First seen Nov 18, 2026; last successful collection Nov 18, 2026. See the methodology.