 PluginStats

Screener.in Better Results Highlighter users statistics
By davidjosephind · Chrome Web Store · Education
Highlight quarterly results on Screener.in when they are better year-over-year.
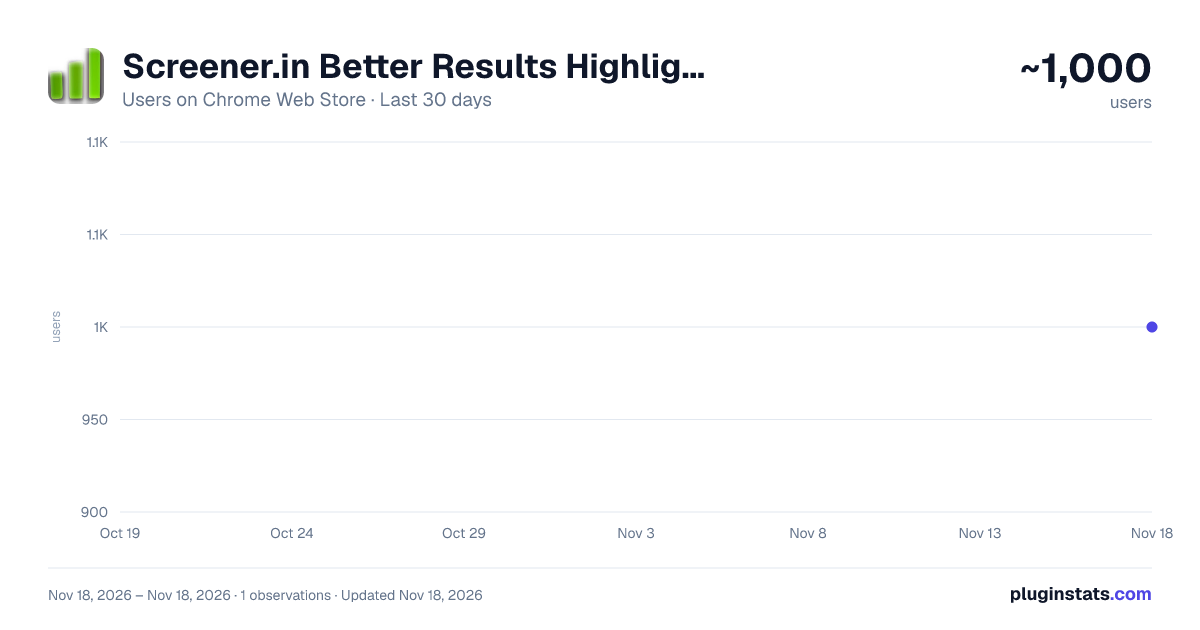
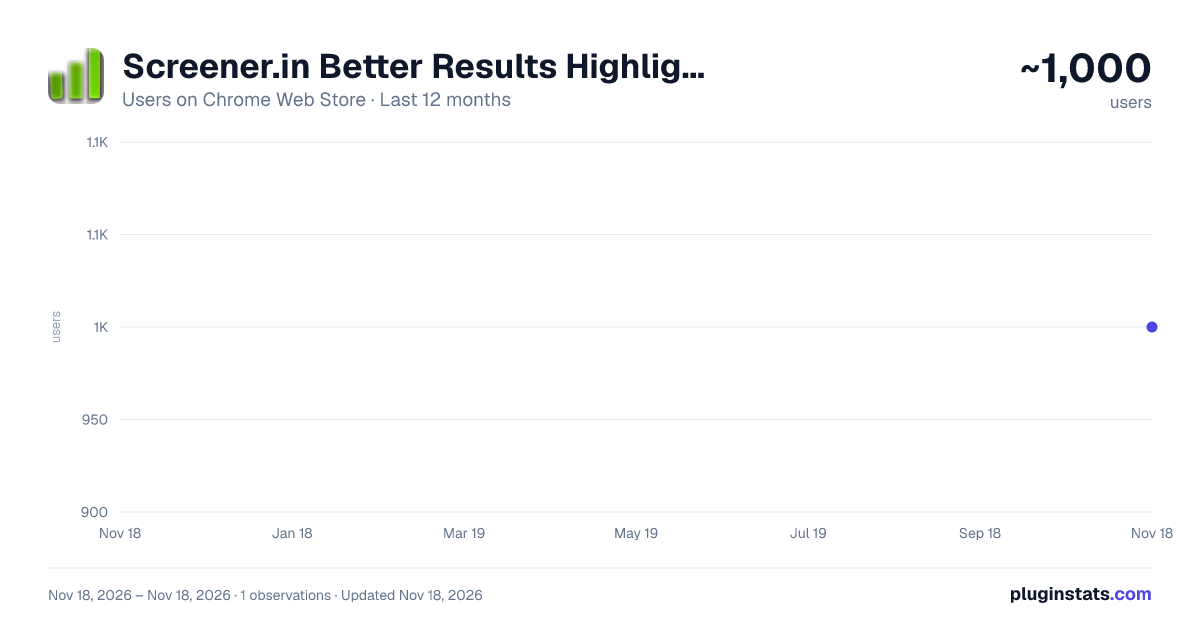
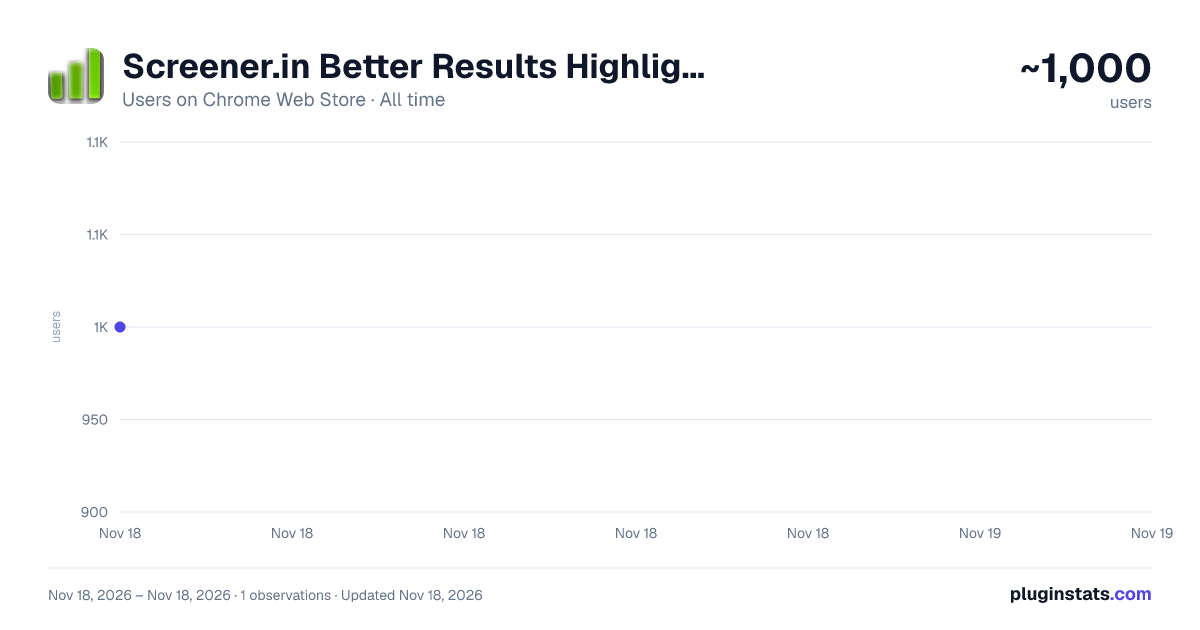
Screener.in Better Results Highlighter has approximately 1,000 recorded users on Chrome Web Store, ranking #3712 of 10,388 tracked listings.
Rating: 4.70 / 5 from 7 ratings
About Screener.in Better Results Highlighter
Highlight quarterly results on Screener.in when they are better year-over-year.
Welcome to Screener.in Better Results Highlighter, the ultimate Chrome extension designed to revolutionize your financial analysis experience on Screener.in. With our tool, deciphering Profit and Loss (P&L) statements becomes not only effortless but also more insightful.
Key Features:
Intelligent Highlighting: Our extension automatically identifies and highlights key metrics within P&L statements. If a metric reflects positive performance, such as increasing revenue or decreasing expenses, the corresponding cell is highlighted in a vibrant green color. This intuitive visual cue allows users to swiftly pinpoint areas of financial strength.
Percentage Improvement Indicator: For essential quarterly and annual metrics, Screener.in Better Results Highlighter goes beyond highlighting. When hovering over individual cells, the extension displays the percentage improvement or decline compared to the previous period. This feature provides invaluable context, enabling users to assess the company's trajectory over time with ease.
Seamless Integration: Once installed, Screener.in Better Results Highlighter seamlessly integrates into your browsing experience. Simply navigate to the P&L section of any company on Screener.in, and our extension will automatically enhance the visibility and interpretability of the financial data. There's no need for manual data entry or complex setup processes.
Time-Saving Efficiency: By streamlining the analysis process and providing instant insights, our extension saves you valuable time. Say goodbye to laboriously poring over rows and columns of financial figures. With Screener.in Better Results Highlighter, you can focus your energy on interpreting the implications of the highlighted metrics and making informed investment decisions swiftly.
Installing Screener.in Better Results Highlighter is simple:
Visit the Chrome Web Store and search for "Screener.in Better Results Highlighter." Click on the "Add to Chrome" button to install the extension. Once installed, navigate to Screener.in and access the P&L statements of any company. Observe the automatic highlighting of positive metrics and hover over cells to view percentage improvements.
Use Cases:
Investment Research: Whether you're an experienced investor or a newcomer to the stock market, our extension provides valuable insights to inform your investment decisions. Quickly identify companies with strong financial performance and growth potential.
Financial Analysis: Financial analysts and professionals can leverage Screener.in Better Results Highlighter to expedite their analysis process. Spend less time on data manipulation and more time on strategic analysis and forecasting.
Educational Tool: For students or enthusiasts interested in learning about financial analysis, our extension serves as an educational resource. By visualizing key financial metrics and trends, users can deepen their understanding of corporate finance concepts.
Screener.in Better Results Highlighter empowers users to unlock the full potential of financial data on Screener.in. With its intuitive features, seamless integration, and time-saving efficiency, this extension is a must-have for anyone involved in company analysis or investment research. Install now and elevate your financial analysis to new heights!
Description from the Chrome Web Store listing.
README badge
Show your rank in a README or on your website. The badge updates automatically.
Charts
Images: 30d · 1y · all time · 1600×900 dark
Adoption over time
7/30/90-day growth
Ranking history
Ratings over time
Listing placement
Listing placement
Filled points are observed values; hollow points come from Internet Archive snapshots of the listing page. Dashed segments span periods with no observations — values between points are not interpolated.
Each band is one page of 20. Users on a linear scale. Placement is projected from users, so it can differ from the marketplace's own sort order. Hover a dot to see the listing.
Recent observations
Full history (1)Similar Chrome Web Store Education plugins
All 20 Screener.in Better Results Highlighter alternatives



Data source
Covers every Chrome Web Store extension with at least 100 users, found through the store's public sitemap. User counts are read from public listing pages. The 10% most-used extensions are refreshed daily, the next 40% weekly and the next 40% monthly; the least-used 10% are not refreshed. Google displays rounded user counts (and caps the display at 10,000,000+), so small changes may not be visible. Rating counts above 1,000 are rounded (e.g. 1.6K).
Listing: https://chromewebstore.google.com/detail/screenerin-better-results/edjinhanokkijkjcnlamjmjonmkjaoka. First seen Nov 18, 2026; last successful collection Nov 18, 2026. See the methodology.