 PluginStats

HttpWatch: HTTP Debugger users statistics
Chrome Web Store · Developer Tools
A clearer, easier-to-use network panel for Chrome: requests grouped by page and headers explained. Requires HttpWatch for Windows.
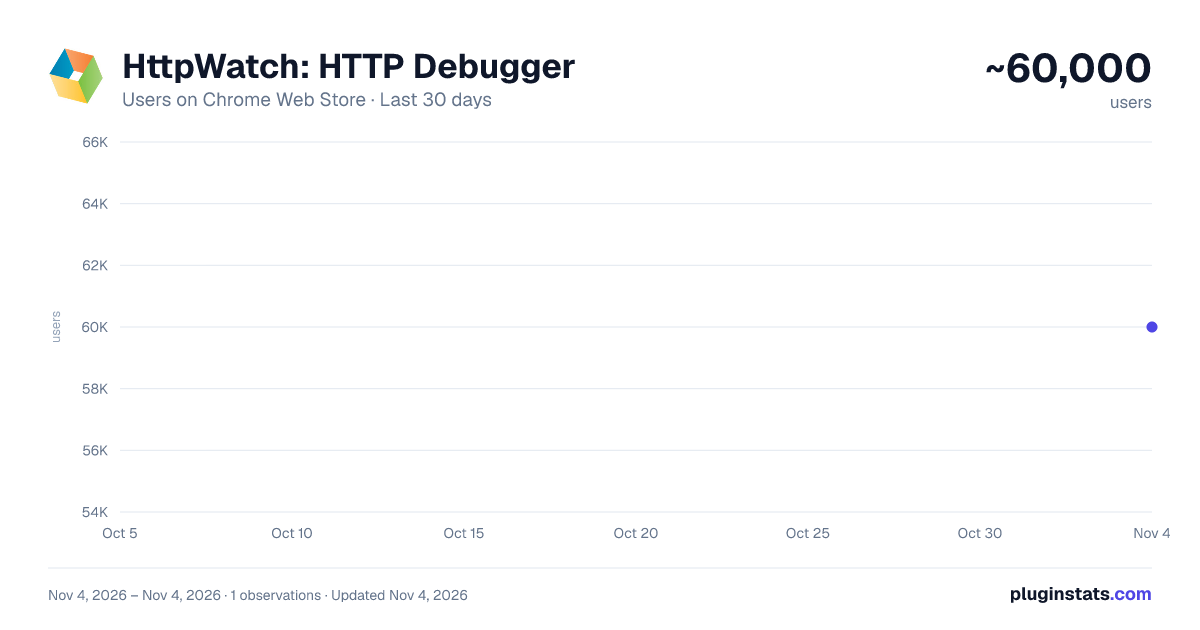
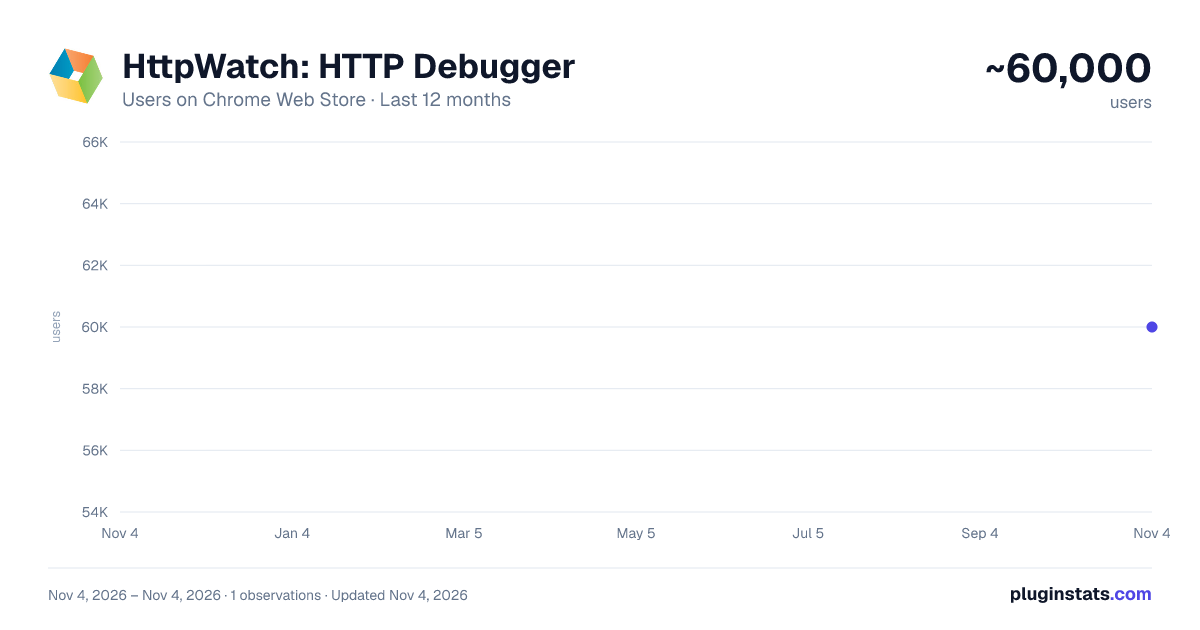
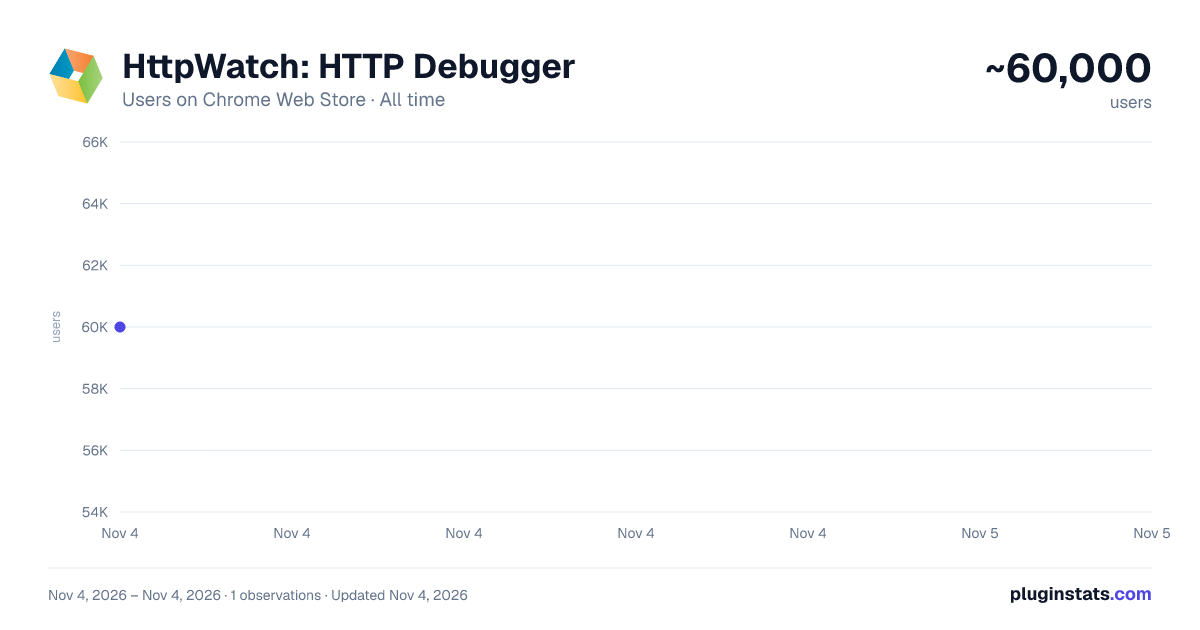
HttpWatch: HTTP Debugger has approximately 60,000 recorded users on Chrome Web Store, ranking #297 of 7,072 tracked listings.
Rating: 2.50 / 5 from 15 ratings
About HttpWatch: HTTP Debugger
A clearer, easier-to-use network panel for Chrome: requests grouped by page and headers explained. Requires HttpWatch for Windows.
🚀 HttpWatch — a clearer, easier-to-use network panel for Chrome
Same network data as the DevTools Network panel, with far less digging. Requests are grouped by page. Headers, cookies and timings are one click away, with the time chart still in view. Hover over any header and a tip explains what it does.
⌨️ Press Ctrl+Shift+H on any page to start.
================================================== ⚠️ IMPORTANT — WINDOWS APP REQUIRED
This extension connects Chrome to the HttpWatch desktop application. It does NOT work on its own.
👉 Download HttpWatch for Windows: https://www.httpwatch.com/download/
🆓 The Basic Edition is free and installs into your own Windows account, with no administrator rights needed.
================================================== ✨ Why HttpWatch is easier to work with
📑 Requests grouped by page Every page you visit gets its own heading, so a log in, search and checkout flow stays readable from start to finish.
🪟 Details without losing your place Click a request and its headers, cookies and timings open below the grid, while the request list and time chart stay in view.
💡 Headers explained as you hover You don't need to know the HTTP RFC. Hover over a header and a tip explains what it does and how it's used.
🚩 Problems flagged for you Warnings appear right in the log for requests that could be faster, weak HTTPS setups, blocked cookies (with the reason) and wrong content types.
⏱️ Timings you can read at a glance Millisecond timings for DNS, connect, TLS and wait, with Render Start and Page Load on the same chart, plus summaries for a page, a selection or the whole log.
🔒 Logs that are safe to share Saved HWL logs include the browser console output, and suspected password fields are masked by default.
================================================== 🆚 HttpWatch vs the DevTools Network panel
❌ DevTools: one flat list, or cleared on every navigation ✅ HttpWatch: requests grouped under each page
❌ DevTools: opening a request hides the waterfall ✅ HttpWatch: details and time chart stay visible together
❌ DevTools: performance insights need a separate tool ✅ HttpWatch: warnings show up right in the request log
❌ DevTools: HAR export only ✅ HttpWatch: HWL, HAR, CSV or XML
🔗 Full comparison: https://www.httpwatch.com/compare/
================================================== 📤 Get a usable log from anyone
Asking a customer or tester to "open DevTools and export a HAR" rarely goes well. With HttpWatch it takes three simple steps:
1️⃣ They install the free Basic Edition. It installs into their own Windows account, so they don't need admin rights, IT, proxies or certificates.
2️⃣ They reproduce the problem and click Save. The .hwl file has every request, timing and console message, with passwords masked.
3️⃣ You open it in HttpWatch Professional and see the full detail for every site in the log, without needing a browser.
================================================== 🔐 No proxy, no certificates
HttpWatch records traffic right inside Chrome:
✅ No proxy settings to change ✅ No root certificate to trust ✅ HTTPS shows up with nothing extra to install ✅ Cache hits, console output and page timings captured too
================================================== 👥 Who HttpWatch is for
🧑💻 Web developers debugging pages and API calls 🧪 QA teams reproducing web application issues 🛠️ Support engineers collecting diagnostic logs from customers 📚 Anyone who wants to learn HTTP and see what the browser is really doing
================================================== 🆓 Free and Professional editions
🆓 HttpWatch Basic Edition is free. It records everything, but only displays full detail (headers, cookies, content and so on) for popular sites such as google.com and amazon.com.
⭐ HttpWatch Professional Edition shows full detail for every site, including logs recorded by Basic Edition users.
🔗 Compare editions: https://www.httpwatch.com/editions/
================================================== 🛡️ Privacy
HttpWatch is a local debugging tool. The extension passes the traffic it records to the HttpWatch application on your PC. Recorded traffic stays on your PC unless you choose to save and share a log file.
================================================== ✅ Requirements
• Google Chrome 105 or later • Windows 10 or later, or Windows Server 2016 or later • HttpWatch for Windows from https://www.httpwatch.com/download/
Description from the Chrome Web Store listing.
README badge
Show your rank in a README or on your website. The badge updates automatically.
Charts
Images: 30d · 1y · all time · 1600×900 dark
Adoption over time
7/30/90-day growth
Ranking history
Ratings over time
Listing placement
Listing placement
Filled points are observed values; hollow points come from Internet Archive snapshots of the listing page. Dashed segments span periods with no observations — values between points are not interpolated.
Each band is one page of 20. Users on a linear scale. Placement is projected from users, so it can differ from the marketplace's own sort order. Hover a dot to see the listing.
Recent observations
Full history (1)Similar Chrome Web Store Developer Tools plugins
All 20 HttpWatch: HTTP Debugger alternatives



Data source
Covers every Chrome Web Store extension with at least 100 users, found through the store's public sitemap. User counts are read from public listing pages. The 10% most-used extensions are refreshed daily, the next 40% weekly and the next 40% monthly; the least-used 10% are not refreshed. Google displays rounded user counts (and caps the display at 10,000,000+), so small changes may not be visible. Rating counts above 1,000 are rounded (e.g. 1.6K).
Listing: https://chromewebstore.google.com/detail/httpwatch-http-debugger/dajhhgiioackgdldomhppobgjbinhimh. First seen Nov 4, 2026; last successful collection Nov 4, 2026. See the methodology.