 PluginStats

ProScreener – Premium Stock Analysis users statistics
A premium stock analysis extension offering advanced trend, cyclical, growth, and money flow insights for smarter trading decisions.
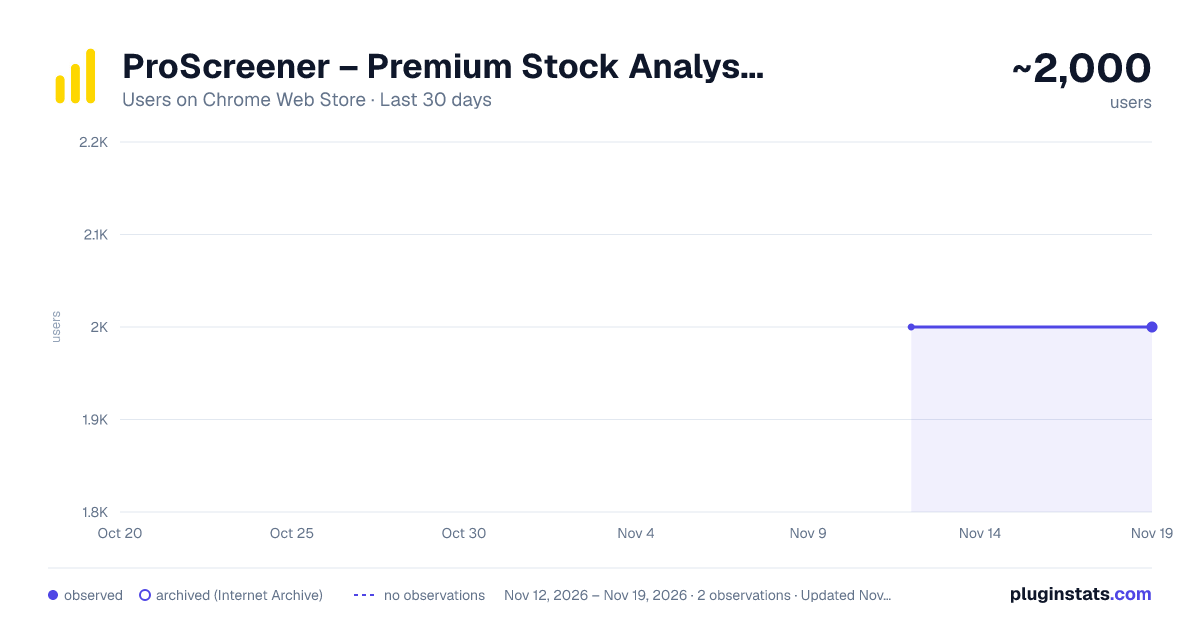
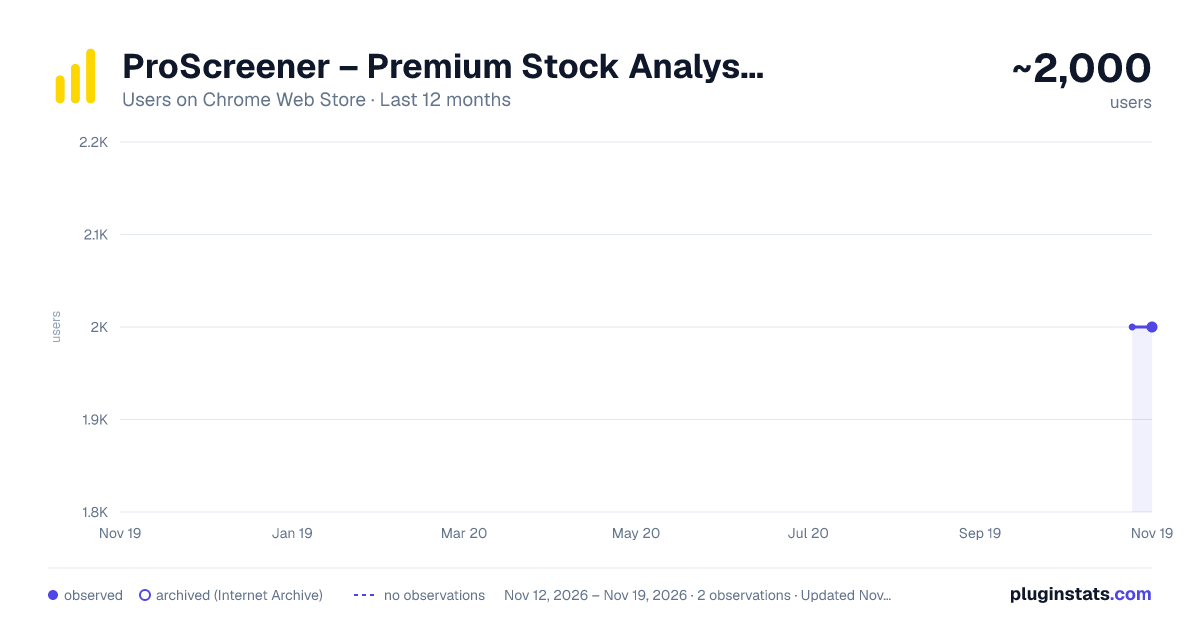
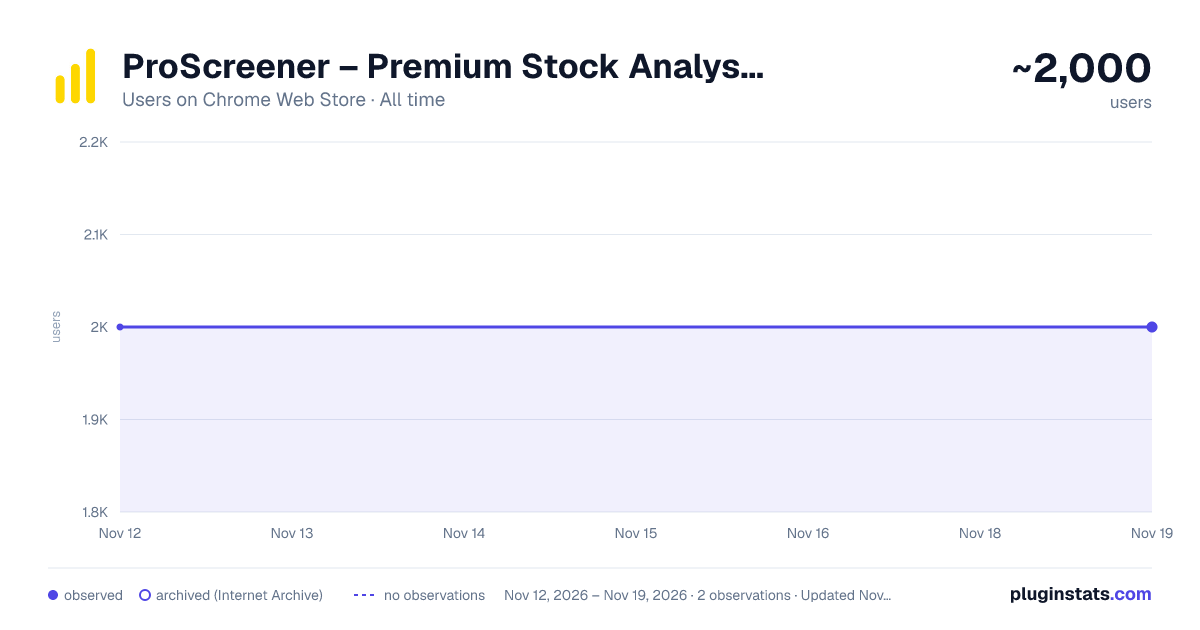
ProScreener – Premium Stock Analysis has approximately 2,000 recorded users on Chrome Web Store, a change of 0.0% over the past 7 days, ranking #2633 of 10,388 tracked listings.
Rating: 5.00 / 5 from 13 ratings
About ProScreener – Premium Stock Analysis
A premium stock analysis extension offering advanced trend, cyclical, growth, and money flow insights for smarter trading decisions.
ProScreener transforms Screener.in and Groww.in into a powerful institutional-grade research platform for investors, traders, and analysts.
Get advanced valuation tools, professional research reports, seasonal analysis, smart money tracking, and actionable insights — directly inside your favorite investing platforms.
📄 Institutional Research Reports (NEW in v4) Generate beautiful, professional-grade stock research reports with a single click. Each report includes: • Executive Summary & Investment Thesis • Financial Performance Analysis • Balance Sheet & Cash Flow Review • Valuation & Peer Comparison • Shareholding & Ownership Trends • Return & Risk Analysis • Technical Analysis & Momentum • Pros, Cons & Risk Factors • Investment Verdict & Recommendation Perfect for investors, analysts, researchers, and portfolio reviews.
💎 Advanced DCF Valuation Calculator (NEW in v4) Discover the intrinsic value of any company using a professional Discounted Cash Flow model. Features include: • 10-Year Two-Stage DCF Model • Bull, Base & Bear Case Scenarios • Valuation Sensitivity Matrix • Margin of Safety Analysis • Adjustable Growth & Discount Rates • Fair Value vs Market Price Comparison
📅 Monthly Returns Heatmap (NEW in v4): Visualize historical seasonality instantly. • Month × Year returns heatmap • Color-coded performance visualization • Identify recurring seasonal patterns • Spot historically strong and weak months
📈 Seasonal Returns Analysis (NEW in v4) Analyze stock performance using TradingView-style seasonal charts. • Compare yearly performance patterns • Visualize cumulative returns by month • Discover long-term seasonal trends • Identify repeatable market behavior
📊 Financial Performance Dashboard Analyze company fundamentals using multiple visualization modes. Track: • Revenue Growth • Net Profit Growth • Operating Margins (OPM) • Earnings Per Share (EPS) • Other key financial metrics
Choose between: • Line Charts • Time-Based Bar Charts • Metric-Based Bar Charts
📆 Yearly Returns Analysis Understand long-term stock performance quickly. Features: • Automatically calculated annual returns • Color-coded performance tables • Historical return comparison charts • Multi-year trend visualization
🔄 Cyclical Analysis Identify recurring business cycles and seasonal behavior. • Detect strong and weak quarters • Rank quarterly performance patterns • Visualize business cycles with heatmaps • Discover hidden seasonal opportunities
📈 Growth vs Valuation Analysis Determine whether a stock is undervalued, fairly valued, or overpriced. Analyze: • Historical business growth • Recent growth acceleration • Stock price appreciation • Fundamental valuation divergence
Get insights such as: • Undervalued • Fairly Valued • Overvalued • Catching Up
💰 Smart Money Flow Analysis Track where institutional money is moving. Monitor: • FII Activity • DII Activity • Promoter Activity • Net Capital Flows • Accumulation & Distribution Trends
📉 Technical Insights Quickly understand a stock's technical position. Includes: • RSI Analysis • 50 DMA & 200 DMA Trends • 52-Week Range Positioning • Momentum Assessment • Risk Indicators
🏛️ Peer Comparison & Ownership Analysis Compare companies like institutional analysts. Features: • Peer Valuation Comparison • Relative Financial Performance • Shareholding Pattern Analysis • Mutual Fund Holdings • Ownership Trend Tracking
📤 Pro Export (NEW in v4) Export financial data instantly. • One-click CSV export • Clean, analysis-ready datasets • Works directly on Screener.in
🎯 Actionable Investment Insights ProScreener converts complex financial data into simple, understandable insights. Get instant answers like: • Strong Buy • Buy • Hold • Caution • Avoid
Along with: • Risk Factors • Investment Catalysts • Valuation Signals • Trend Analysis • Business Quality Assessment
🚀 How to Use Install ProScreener. Open any stock page on Screener.in or Groww.in. ProScreener automatically enhances the page with advanced institutional-grade analysis tools.
No setup required.
👨💼 Who Is ProScreener For?
- Investors
- Perform deep fundamental research in minutes instead of hours.
- Traders
- Identify trends, momentum, seasonality, and institutional activity.
- Financial Analysts
- Generate professional research reports and valuation models instantly.
- Portfolio Managers
Monitor valuation, risk, ownership, and market sentiment efficiently.
ProScreener gives retail investors access to tools traditionally available only to professional analysts and institutions, helping you research smarter, invest confidently, and make better decisions.
Description from the Chrome Web Store listing.
README badge
Show your rank in a README or on your website. The badge updates automatically.
Charts
Images: 30d · 1y · all time · 1600×900 dark
Adoption over time
7/30/90-day growth
Ranking history
Ratings over time
Listing placement
Listing placement
Filled points are observed values; hollow points come from Internet Archive snapshots of the listing page. Dashed segments span periods with no observations — values between points are not interpolated.
Each band is one page of 20. Users on a linear scale. Placement is projected from users, so it can differ from the marketplace's own sort order. Hover a dot to see the listing.
Recent observations
Full history (2)Similar Chrome Web Store Tools plugins
All 20 ProScreener – Premium Stock Analysis alternatives



Data source
Covers every Chrome Web Store extension with at least 100 users, found through the store's public sitemap. User counts are read from public listing pages. The 10% most-used extensions are refreshed daily, the next 40% weekly and the next 40% monthly; the least-used 10% are not refreshed. Google displays rounded user counts (and caps the display at 10,000,000+), so small changes may not be visible. Rating counts above 1,000 are rounded (e.g. 1.6K).
Listing: https://chromewebstore.google.com/detail/proscreener-–-premium-sto/medanenlcinppaiahpfiogjpoeehemkh. First seen Nov 12, 2026; last successful collection Nov 19, 2026. See the methodology.