 PluginStats

Stock Analysis Overlay (Simply Wall St) users statistics
Chrome Web Store · Workflow & Planning
An AI powered analysis overlay
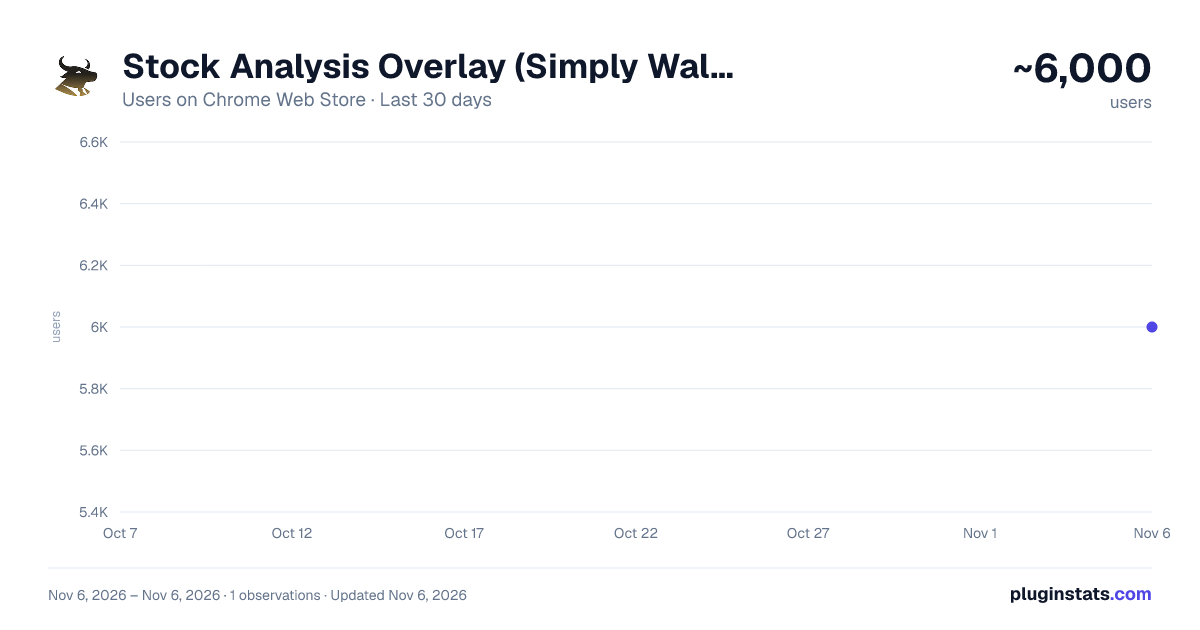
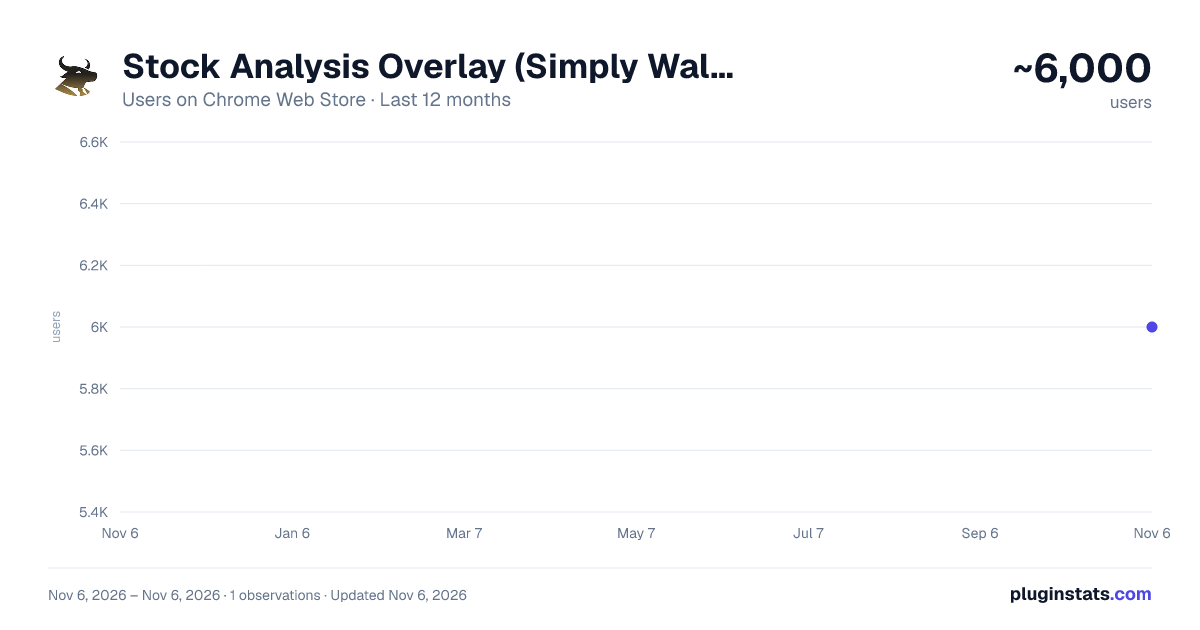
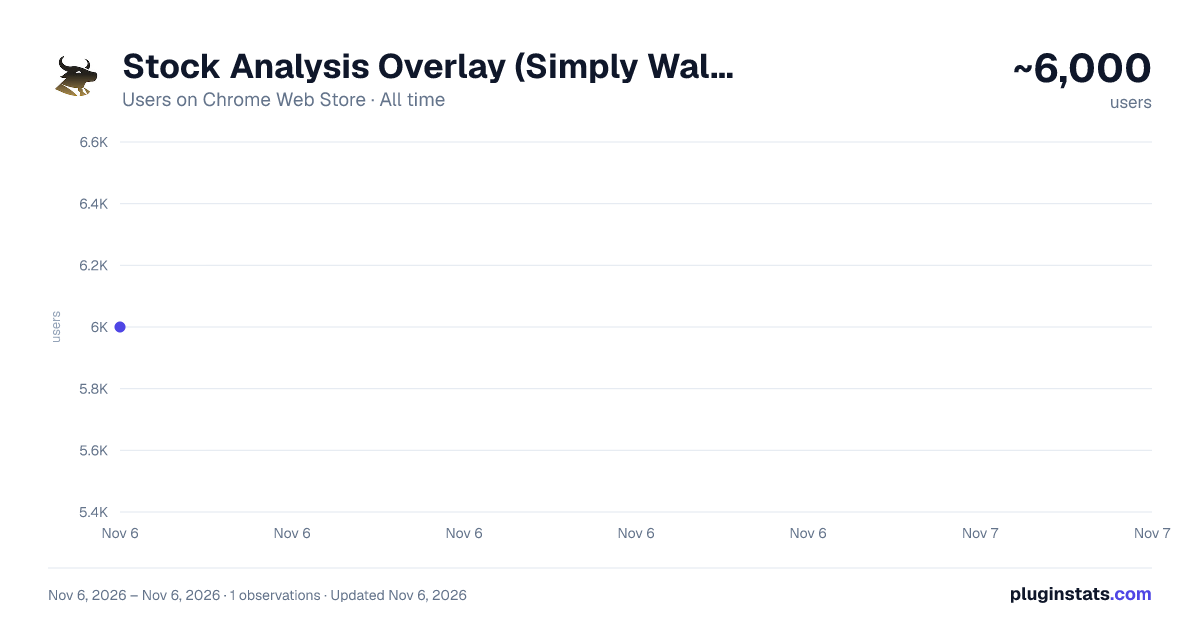
Stock Analysis Overlay (Simply Wall St) has approximately 6,000 recorded users on Chrome Web Store, ranking #1160 of 7,624 tracked listings.
Rating: 3.80 / 5 from 12 ratings
About Stock Analysis Overlay (Simply Wall St)
An AI powered analysis overlay
Replace your new tab page with financial stock analysis from the US, UK or AU market and a natural landscape to calm your mind and increase your focus.
This extension (for US, UK and AU primary markets only) also joins the dots between the companies you're reading about (for example) on Bloomberg, and our analysis.
It works by finding and highlighting potential listed companies (from a selected default market) within the news articles you're reading. Then gives you access to our analysis for those companies with one click.
There are 2 ways to trigger the extension: ➤ Visit one of the extension's watched sites (e.g. bloomberg.com, TechCrunch, Forbes, CNBC, plus many more) ➤ Right click the extension's icon in your Chrome toolbar.
By default, it will look to highlight companies from US markets. However, you can update your default market via the extension's options page (left click the extension's icon and select options). You can choose between US, Australian and British markets.
What can you do with Simply Wall St’s Stock Analysis Overlay?
➤ Keep an eye on the latest stock market news and developments
See how the market performed over the last 7 days, 3 months, and year-to-date with highlights on the strongest sectors driving gains.
Want to know which individual stocks are moving the market? The market movers tab updates daily to show you the biggest gainers and losers making waves.
Whether you use the extension at home or at work, staying up to date with the market has never been easier.
➤ Discover new stocks daily
With the stock analysis overlay, you can discover new stocks with just one click. Explore companies from new markets and sectors across the world or learn more about the competitors of a company you’re invested in.
Powered by Simply Wall St’s exhaustive analysis on every listed stock worldwide we’ll help you uncover the hidden gems. Find new companies or learn more about the competitors of a company you’re invested in.
➤ Deep dive into any stock in seconds
Cut through the noise of analysts and articles online with easy to use analysis tools at your fingertips. Simply click on the overlay button to access recent updates, fair value analysis, and future growth charts to get a quick overlook of a company’s prospects. You can even create notes to review later.
Looking for more information on a particular stock? Just click through the full report on Simply Wall St where we make stock research easier than ever before.
Privacy Policy: https://simplywall.st/privacypolicy
Description from the Chrome Web Store listing.
README badge
Show your rank in a README or on your website. The badge updates automatically.
Charts
Images: 30d · 1y · all time · 1600×900 dark
Adoption over time
7/30/90-day growth
Ranking history
Ratings over time
Listing placement
Listing placement
Filled points are observed values; hollow points come from Internet Archive snapshots of the listing page. Dashed segments span periods with no observations — values between points are not interpolated.
Each band is one page of 20. Users on a linear scale. Placement is projected from users, so it can differ from the marketplace's own sort order. Hover a dot to see the listing.
Recent observations
Full history (1)Similar Chrome Web Store Workflow & Planning plugins
All 20 Stock Analysis Overlay (Simply Wall St) alternatives



Data source
Covers every Chrome Web Store extension with at least 100 users, found through the store's public sitemap. User counts are read from public listing pages. The 10% most-used extensions are refreshed daily, the next 40% weekly and the next 40% monthly; the least-used 10% are not refreshed. Google displays rounded user counts (and caps the display at 10,000,000+), so small changes may not be visible. Rating counts above 1,000 are rounded (e.g. 1.6K).
Listing: https://chromewebstore.google.com/detail/stock-analysis-overlay-si/fogdlgjnkolhbefbbpghbafdkhcdgdnk. First seen Nov 6, 2026; last successful collection Nov 6, 2026. See the methodology.