 PluginStats

Grafana Dashboards users statistics
Chrome Web Store · Developer Tools
Quick access to Grafana dashboard for Prometheus monitoring, Kubernetes, Loki, Tempo, and infrastructure monitoring
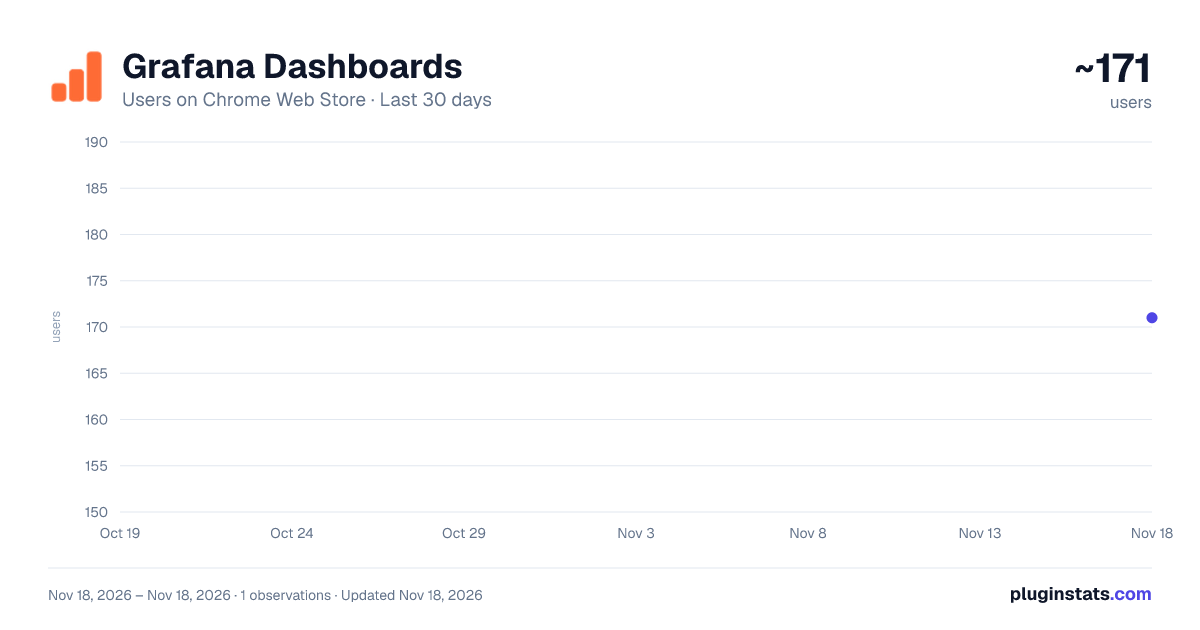
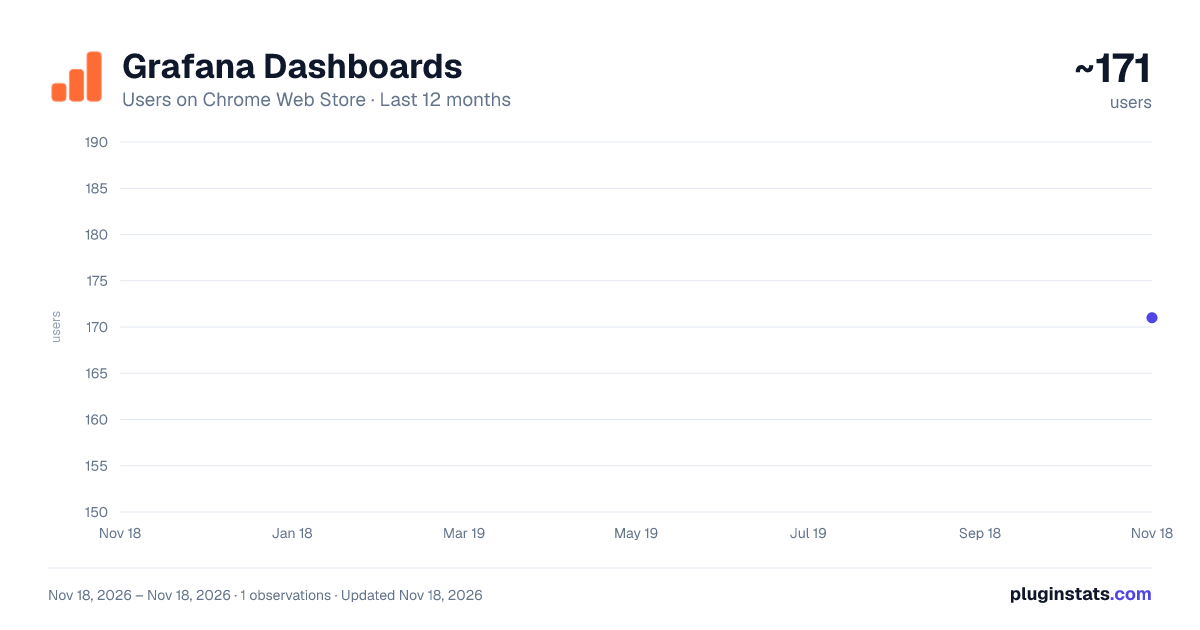
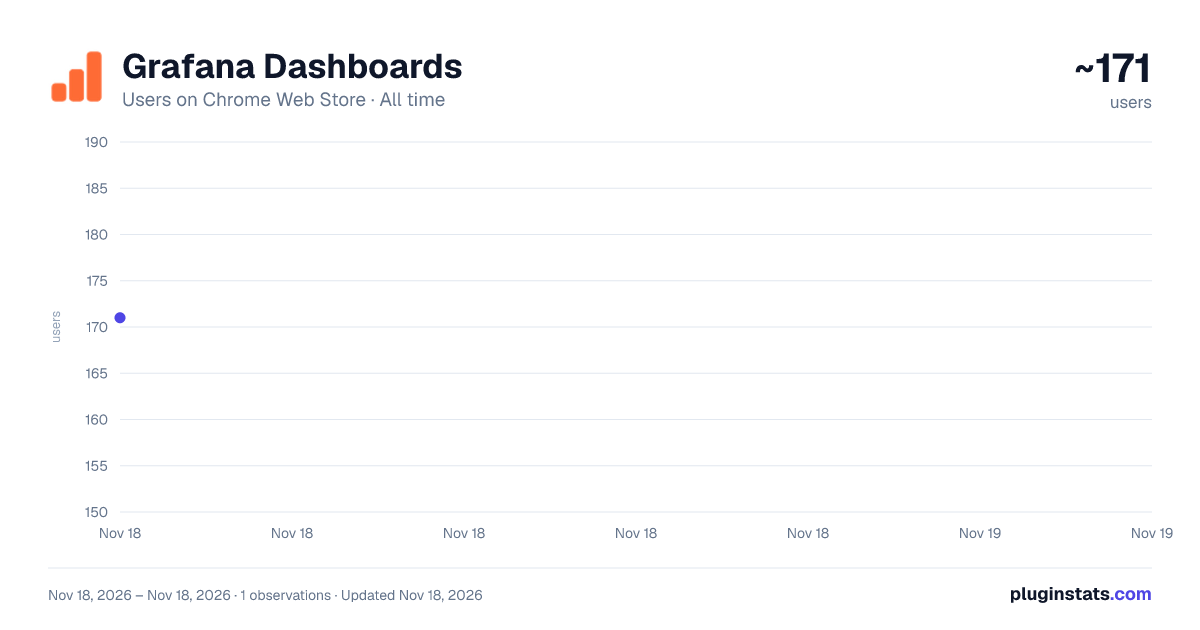
Grafana Dashboards has approximately 171 recorded users on Chrome Web Store, ranking #8331 of 10,388 tracked listings.
Rating: 5.00 / 5 from 1 ratings
About Grafana Dashboards
Quick access to Grafana dashboard for Prometheus monitoring, Kubernetes, Loki, Tempo, and infrastructure monitoring
Grafana Dashboards - Instant Access to Your Monitoring Data
Stop juggling tabs and bookmarks. Access your grafana dashboard directly from any website with context-aware intelligence that shows only relevant dashboards for each domain. Perfect for managing cloud infrastructure, tracking application performance monitoring, or handling kubernetes monitoring.
🚀 KEY FEATURES
✅ Smart Domain Mapping - Configure custom dashboard lists for each domain. The extension displays relevant grafana dashboards when you visit your sites. ✅ One-Click Dashboard Access - Launch any grafana dashboard instantly. Perfect for DevOps, SRE, and development teams. ✅ Multi-Instance Support - Works with grafana prometheus, grafana loki, grafana tempo, aws managed grafana, and azure managed grafana. ✅ Customizable Dashboard Collections - Build focused dashboard lists for production, development, and infrastructure monitoring scenarios.
💡 PERFECT FOR
DevOps Engineers, SRE Teams, Developers, Platform Engineers managing kubernetes monitoring and distributed tracing, and IT Operations teams handling telemetry data analysis.
🎯 USE CASES
⚡ Incident Response - On-call alert? Navigate to the service domain, click the extension, and immediately access prometheus monitoring metrics, log aggregation, and distributed tracing views configured for that service.
⚡ Multi-Environment - Managing staging, production, and development? Configure different sets for each domain. The extension shows the right views when you switch environments.
⚡ Team Collaboration - Share configurations across your team. Everyone gets instant access to standardized views for each service, ensuring consistent observability practices.
⚡ Faster Response - During incidents, access critical data—including grafana mimir metrics, node exporter data, or blackbox exporter results—with minimal clicks instead of navigating bookmark folders.
🔧 TECHNICAL CAPABILITIES
Comprehensive Integration Support Works with popular monitoring stacks: Prometheus + Grafana setups, Grafana Loki for log aggregation, Grafana Tempo for distributed tracing, InfluxDB via grafana influxdb, Elasticsearch through grafana elasticsearch, and custom observability tools.
Flexible Configuration ⚙️ Domain pattern matching with wildcard support ⚙️ Custom dashboard ordering and prioritization ⚙️ Dashboard grouping and categorization ⚙️ Quick search within configured dashboards ⚙️ Support for dashboard variables and parameters
Security & Privacy 🔒 All configuration stored locally in your browser 🔒 No external data transmission 🔒 Works entirely client-side 🔒 Support for authentication tokens
📊 STREAMLINE YOUR OBSERVABILITY WORKFLOW
Modern cloud monitoring demands efficient tools. Whether you're running containers with kubernetes monitoring, tracking microservices with application performance monitoring, or maintaining traditional server infrastructure, quick dashboard access accelerates troubleshooting and improves response times.
The extension transforms how teams interact with their observability platform by eliminating navigation friction. Configure once per domain, then enjoy instant access to relevant metrics, logs, and traces whenever you need them.
🌟 WHY CHOOSE THIS EXTENSION?
Context-Aware Intelligence Unlike generic bookmark managers, this extension understands which dashboards matter for each domain. Your grafana tempo traces for the payment service? Only shown when you're on that domain. Infrastructure monitoring for the API gateway? Automatically available when viewing that service.
Productivity Boost Teams report 60% faster access to monitoring data compared to traditional bookmark-based workflows. Reduce context switching, minimize clicks, and keep focus on solving problems rather than finding dashboards.
Seamless AWS & Azure Integration Native support for aws grafana and azure managed grafana means enterprise teams can leverage managed services while maintaining efficient dashboard access patterns.
🚦 GET STARTED IN MINUTES
Install the extension from Chrome Web Store, configure your Grafana instance URL, map dashboards to domains you monitor, and start accessing your monitoring data faster than ever.
Perfect for teams using prometheus monitoring, application monitoring solutions, grafana docker deployments, or any grafana-based observability tools. Transform your monitoring workflow today with context-aware dashboard access that actually understands your infrastructure.
Stop wasting time navigating complex grafana instances. Get instant access to the right dashboard at the right time, every time.
Description from the Chrome Web Store listing.
README badge
Show your rank in a README or on your website. The badge updates automatically.
Charts
Images: 30d · 1y · all time · 1600×900 dark
Adoption over time
7/30/90-day growth
Ranking history
Ratings over time
Listing placement
Listing placement
Filled points are observed values; hollow points come from Internet Archive snapshots of the listing page. Dashed segments span periods with no observations — values between points are not interpolated.
Each band is one page of 20. Users on a linear scale. Placement is projected from users, so it can differ from the marketplace's own sort order. Hover a dot to see the listing.
Recent observations
Full history (1)Similar Chrome Web Store Developer Tools plugins
All 20 Grafana Dashboards alternatives



Data source
Covers every Chrome Web Store extension with at least 100 users, found through the store's public sitemap. User counts are read from public listing pages. The 10% most-used extensions are refreshed daily, the next 40% weekly and the next 40% monthly; the least-used 10% are not refreshed. Google displays rounded user counts (and caps the display at 10,000,000+), so small changes may not be visible. Rating counts above 1,000 are rounded (e.g. 1.6K).
Listing: https://chromewebstore.google.com/detail/grafana-dashboards/ofdifaldlndiadcniddacpldchidpngf. First seen Nov 18, 2026; last successful collection Nov 18, 2026. See the methodology.