 PluginStats

WebGPU Inspector users statistics
By Brendan Duncan · Chrome Web Store · Developer Tools
DevTools debugger and profiler for WebGPU — inspect objects, capture frames, edit shaders live, and analyze GPU performance.
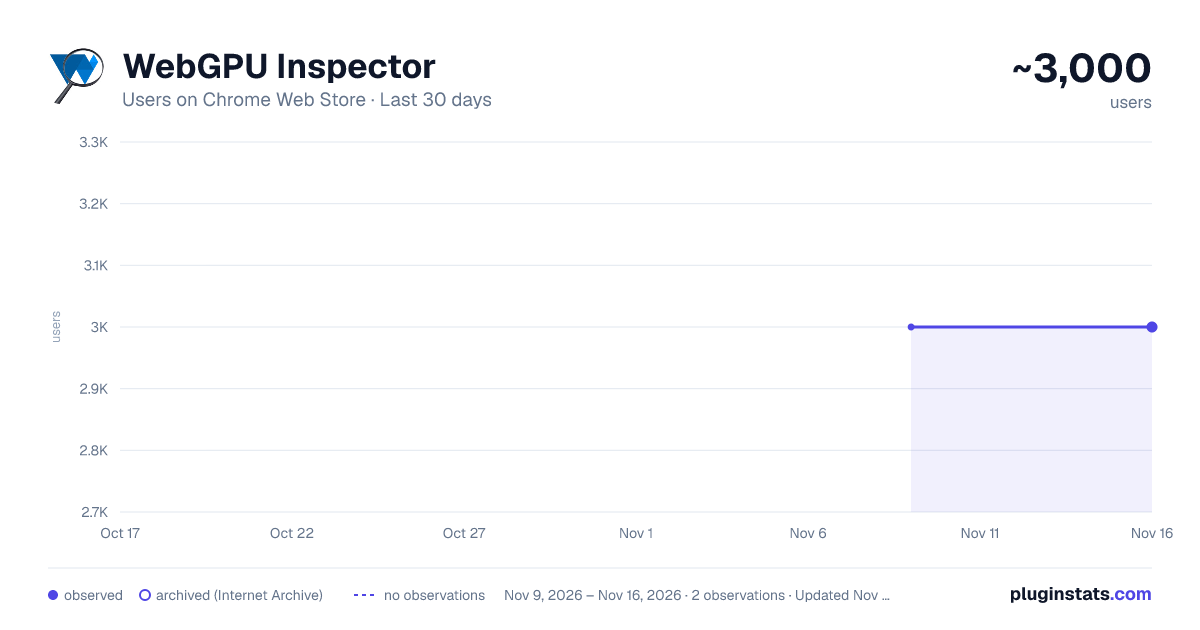
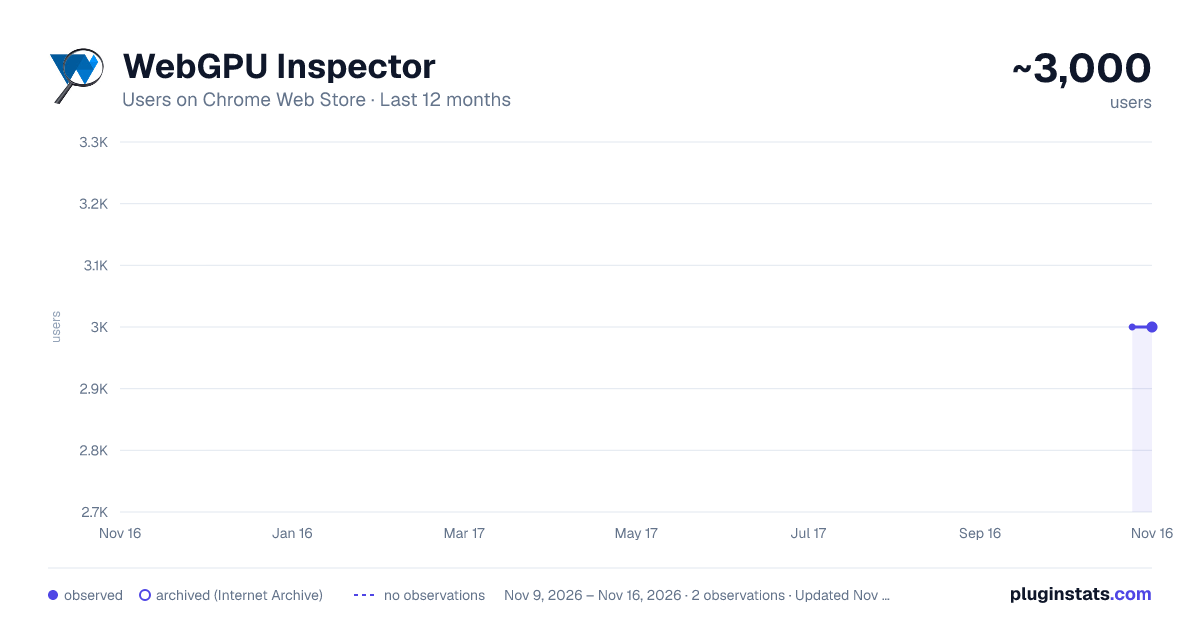
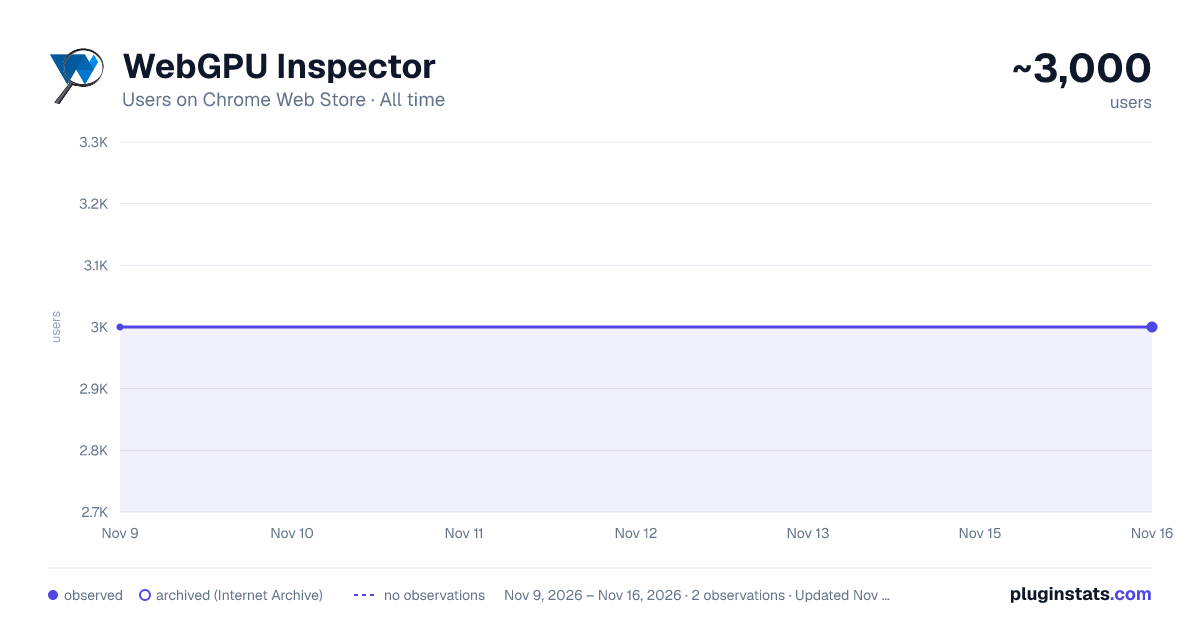
WebGPU Inspector has approximately 3,000 recorded users on Chrome Web Store, a change of 0.0% over the past 7 days, ranking #2155 of 10,388 tracked listings.
Rating: 4.90 / 5 from 14 ratings
About WebGPU Inspector
DevTools debugger and profiler for WebGPU — inspect objects, capture frames, edit shaders live, and analyze GPU performance.
WebGPU Inspector is the extension for debugging and profiling WebGPU applications — RenderDoc-style graphics debugging, right inside Chrome DevTools.
🔍 Inspect • Browse every live WebGPU object with full details and the stack trace showing exactly where it was created. • Plot frame times and GPU object counts over time to track performance. • Texture viewer, look at individual pixel values. • Edit shaders live on the page to test and fix changes without reloading.
🖼️ Capture • Capture one or more frames with all of their commands, buffers, textures, and render pass results. • Auto-inject render and compute pass timestamp queries to measure performance and identify bottlenecks. • Debug shaders (experimental). Step through shader execution, watching variable values. • Save and reload captures, open in multiple tabs or windows, useful for A | B analysis.
🔵 Record • Record the commands and data for a set of frames and export a standalone HTML or binary file that reproduces the render anywhere — perfect for bug reports and regression tests. • Play back the recorded frame, with the ability to step through the commands to render up to that point. • Edit and disable commands in the recording to help investigate rendering issues.
Description from the Chrome Web Store listing.
README badge
Show your rank in a README or on your website. The badge updates automatically.
Charts
Images: 30d · 1y · all time · 1600×900 dark
Adoption over time
7/30/90-day growth
Ranking history
Ratings over time
Listing placement
Listing placement
Filled points are observed values; hollow points come from Internet Archive snapshots of the listing page. Dashed segments span periods with no observations — values between points are not interpolated.
Each band is one page of 20. Users on a linear scale. Placement is projected from users, so it can differ from the marketplace's own sort order. Hover a dot to see the listing.
Recent observations
Full history (2)Similar Chrome Web Store Developer Tools plugins
All 20 WebGPU Inspector alternatives



Data source
Covers every Chrome Web Store extension with at least 100 users, found through the store's public sitemap. User counts are read from public listing pages. The 10% most-used extensions are refreshed daily, the next 40% weekly and the next 40% monthly; the least-used 10% are not refreshed. Google displays rounded user counts (and caps the display at 10,000,000+), so small changes may not be visible. Rating counts above 1,000 are rounded (e.g. 1.6K).
Listing: https://chromewebstore.google.com/detail/webgpu-inspector/holcbbnljhkpkjkhgkagjkhhpeochfal. First seen Nov 9, 2026; last successful collection Nov 16, 2026. See the methodology.