 PluginStats
@ooples/token-optimizer-mcp weekly downloads statistics
By ooples · npm · Claude Code
Audit net MCP context avoided per AI coding agent, optimize context, and share a live local knowledge graph across 16 CLI clients
@ooples/token-optimizer-mcp has 1,257 recorded weekly downloads on npm, an increase of 4.0% over the past 30 days.
It ranks #1354 of 2,256 tracked npm listings by weekly downloads.
Over 90 days, weekly downloads changed by +442%.
PluginStats has 121 daily observations since Jun 19, 2026; the latest is from Oct 17, 2026.
About @ooples/token-optimizer-mcp
Token Optimizer MCP
Compression that optimises your bill, not your byte count — and ships the benchmark so you can check it.
One local ledger for optimizer tools, live-graph substitutions, every agent, and the graph's own cost.
Why it wins
Providers cache the prompt prefix: cached tokens re-read at 0.1x, rewritten ones bill at 1.25x. Most compressors optimise bytes removed and ignore that multiplier. This one optimises the bill.
**It wins both columns, against their real implementation, on their own fixtures.** Not a reimplementation and not our fixtures: their harness compresses the payload, dumps it, their resolver redeems their own markers, and ours is handed the identical bytes.
| workload | payload | theirs | ours | ours, preset | ours, dial on | zero-turn ids |
| agent-loop | 172,110 | 41.9% / 46.7% | 93.8% / 94.7% | 93.8% / 94.7% | 100.0% / 100.0% | 69 / 254 / 69 | | agent-loop-logs | 328,490 | 51.3% / 45.8% | 96.3% / 97.1% | 96.3% / 97.1% | 100.0% / 100.0% | 87 / 2042 / 87 | | browser-session | 782,294 | 21.8% / 13.6% | 93.7% / 28.9% | 100.0% / 99.9% | 100.0% / 99.9% | 336 / 336 / 0 | | code-search | 131,444 | 47.5% / 53.5% | 95.8% / 96.5% | 95.8% / 96.5% | 99.9% / 99.9% | 65 / 470 / 65 | | codebase-exploration | 136,113 | 99.7% / 99.6% | 65.1% / 58.0% | 100.0% / 99.9% | 100.0% / 99.9% | 509 / 5 / 0 | | grep-output | 75,399 | 99.6% / 99.6% | 57.4% / 52.8% | 99.9% / 99.9% | 99.9% / 99.9% | 1046 / 4 / 0 | | human-authored-json | 38,645 | 32.8% / 31.3% | 96.9% / 97.2% | 96.9% / 97.2% | 99.8% / 99.9% | 18 / 174 / 18 | | issue-triage | 109,534 | 53.1% / 54.4% | 95.3% / 95.9% | 95.3% / 95.9% | 99.9% / 99.9% | 34 / 504 / 34 | | raw-build-log | 158,237 | 99.8% / 99.8% | 70.7% / 47.7% | 100.0% / 100.0% | 100.0% / 100.0% | 430 / 3 / 0 | | relevance-probe | 49,367 | 64.3% / 65.4% | 96.1% / 97.0% | 96.1% / 97.0% | 99.9% / 99.9% | 24 / 527 / 24 | | repeated-reads | 152,321 | 22.8% / 20.5% | 74.3% / 69.7% | 100.0% / 100.0% | 100.0% / 100.0% | 361 / 405 / 0 | | sre-debugging | 312,456 | 88.4% / 90.5% | 97.1% / 97.7% | 97.1% / 97.7% | 100.0% / 100.0% | 89 / 514 / 89 |
Recorded 2026-09-25 at 18a2d085, by the command in the record's regenerate field. That second arm runs HeadRoom itself, so CI does not re-derive it the way it re-derives the table below -- it checks this provenance and these figures against bench/compression/headroom/results/head-to-head.json instead.
Over the corpus the shipped default takes 89.4% of the characters and 80.9% of the tokens; theirs takes 51.3% and 62.8%. Of the 9,919 identifiers planted in the corpus, 45 end up unrecoverable on our side and 8 on theirs.
**Read the rows, though, because the ones we lose are not compression results.** On grep-output, codebase-exploration and raw-build-log they report ~99.7% and we report 57-71%. Their number there is a **content-cache reference**: the block is not made smaller, it is taken out of the request, put in a store, and replaced by a 24-character > marker. The same is true of the four rows where they edge us out in the nineties.
So the last column is the one that decides a turn. A marker is not the content: to read what it stands for, the agent spends a request. zero-turn ids counts the identifiers planted in each workload that need no such request -- still in the text, or rebuildable from the text alone. On the three rows we lose on reduction we take that column outright, 509-5, 1046-4 and 430-3: their marker leaves almost none of it behind, our skeleton leaves all of it. **We lose it on eight rows** -- agent-loop, agent-loop-logs, code-search, human-authored-json, issue-triage, relevance-probe, repeated-reads and sre-debugging -- because our reduction there comes from spilling too, and a spill costs the same turn theirs does; browser-session ties at 336-336. Over the corpus it is 3,068 of 9,919 for us against 5,238 for them: **this column goes to them**, and the two columns have to be read together or each one flatters somebody.
The unit count moved with the instrument, not with the product. Every rule that found a retention unit keyed on a digit-bearing token, a markdown heading or a declaration, so issue-triage ("number": 3000) and relevance-probe ("id": "evt_0", the needle that workload exists to find) each scored ZERO units and reported a tie on an empty set. Counting a string value under an object key and a quoted substring inside a longer string -- on both arms, and excluding multi-line values, which are not literal substrings of the block they came from -- takes the corpus from 6,098 units to 9,919 and reverses this column, which read 2,717 against 2,278 before the fix.
browser-session used to be the one genuine engine loss on this corpus, at 6.0% against their 21.8%. It is now 93.7%, from folding exact long repeats inside a block rather than at a boundary someone else drew — a serialised message list with inline images is a single 780,000-character line, which every other pass here reads as one unit.
Most of that 93.7% is the fixture, and the honest number is lower. This payload holds four images, two of them distinct, and the base64 in them is generated rather than photographic: one distinct image alone folds from 160,032 characters to 5,572, which no real PNG would do. What carries over to a real session is the duplication — half the image bytes here are a second copy of an image already in the request, which is 44.3% of the whole payload, and an agent re-sending a screenshot it has already sent is ordinary. Folding only that is a ~44% reduction, still ahead of their 21.8% on the same row, and the generated base64 is worth about 49 points on top that we would not claim twice.
The run the marker names is still in the output above it, so the reader rebuilds it without asking for anything, which is why the characters fall much further than the tokens (28.9%) — the image tokens are counted from pixels on both arms either way.…
Description from the npm listing.
- mcp
- model-context-protocol
- claude
- claude-code
- token-optimization
- caching
- compression
- ai
- llm
- context-management
- prompt-optimization
Where @ooples/token-optimizer-mcp sits in the listing
Each band is one page of 20. Weekly downloads on a log scale. Placement is projected from weekly downloads, so it can differ from the marketplace's own sort order. Hover a dot to see the listing.


Charts
Images: 30d · 1y · all time · 1600×900 dark
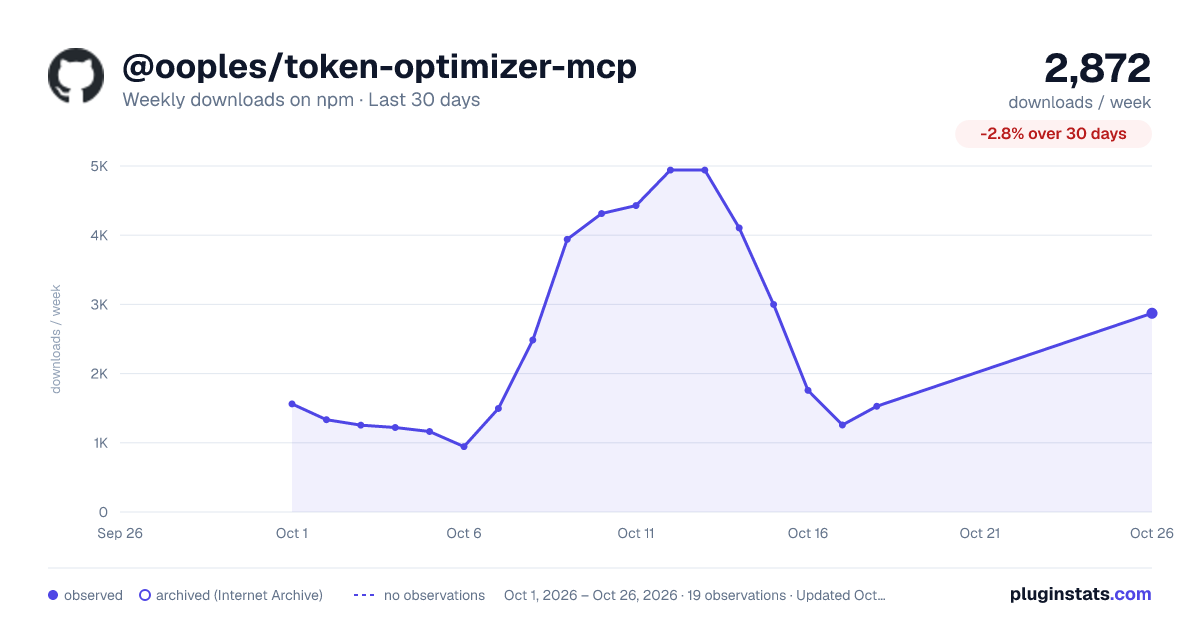
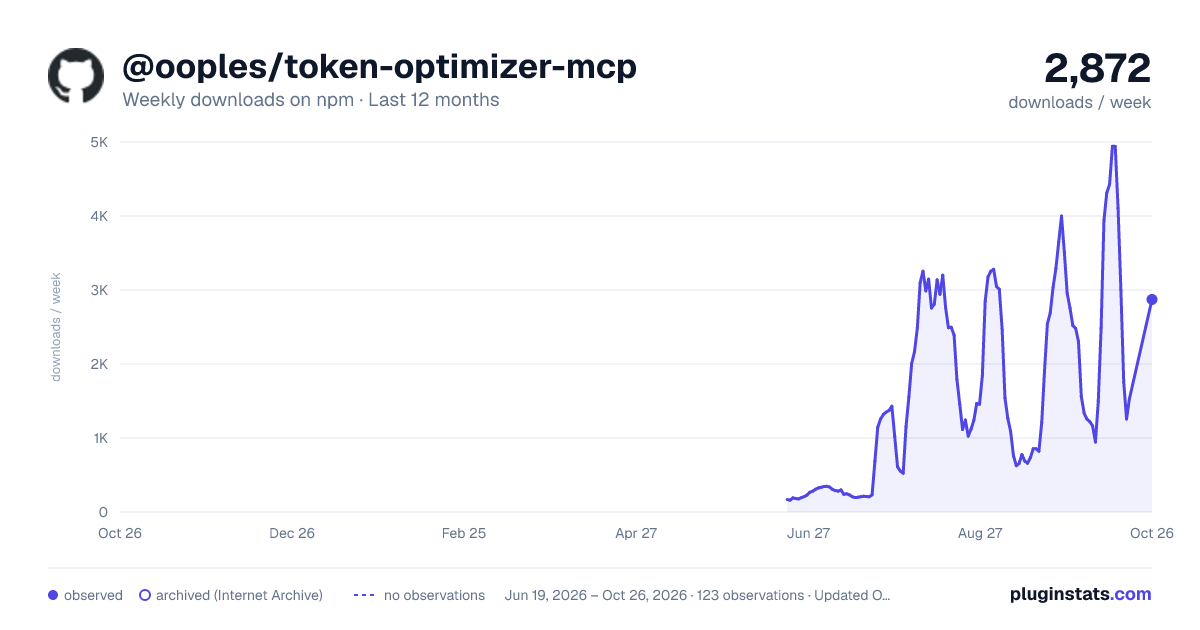
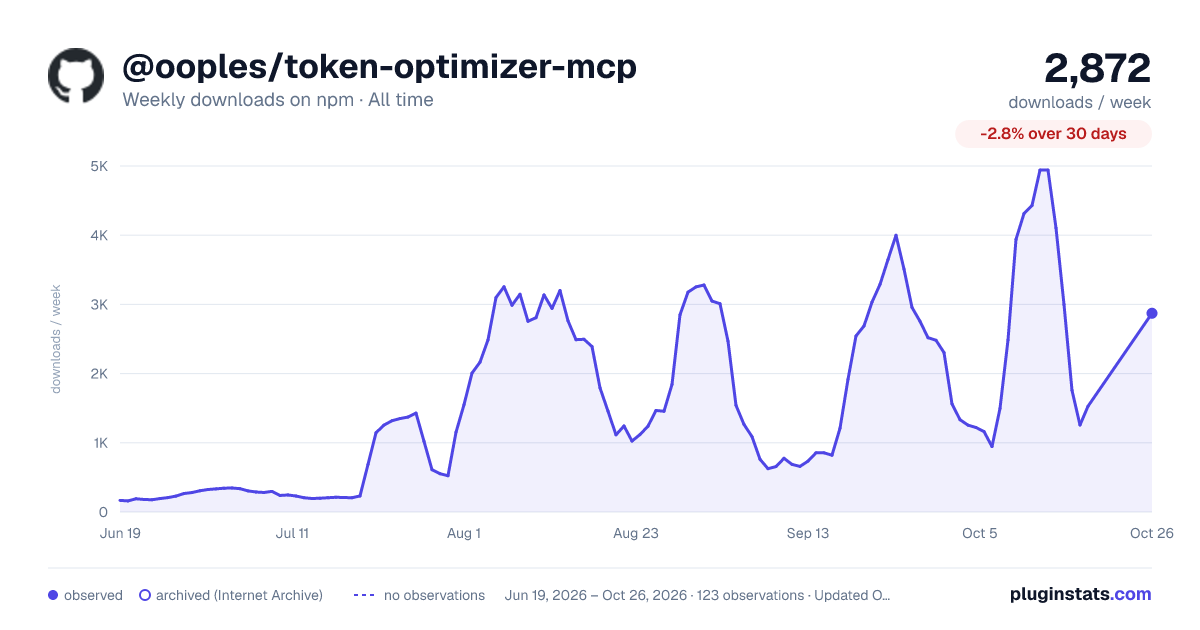

Adoption over time


7/30/90-day growth


Filled points are observed values; hollow points come from Internet Archive snapshots of the listing page. Dashed segments span periods with no observations — values between points are not interpolated.
Recent observations
Full history (121)Similar npm Claude Code plugins
Data source
Weekly downloads (trailing 7 complete days) come from the official npm downloads API. Downloads include CI and mirrors and are not equivalent to installs or users. npm publishes no ratings.
Listing: https://www.npmjs.com/package/@ooples/token-optimizer-mcp. First seen Oct 16, 2026; last successful collection Oct 19, 2026. See the methodology.