 PluginStats
Lua Debugger installs statistics
By devCAT · VS Code Marketplace · Debuggers
Visual Studio Code debugger extension for Lua 5.1, 5.2, 5.3
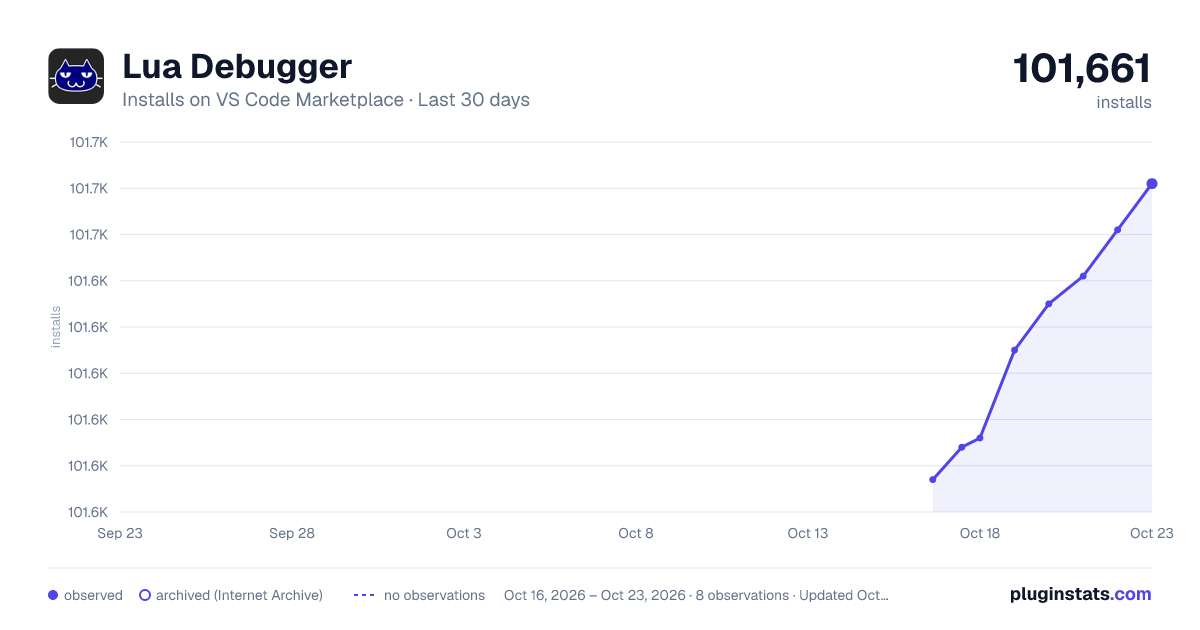
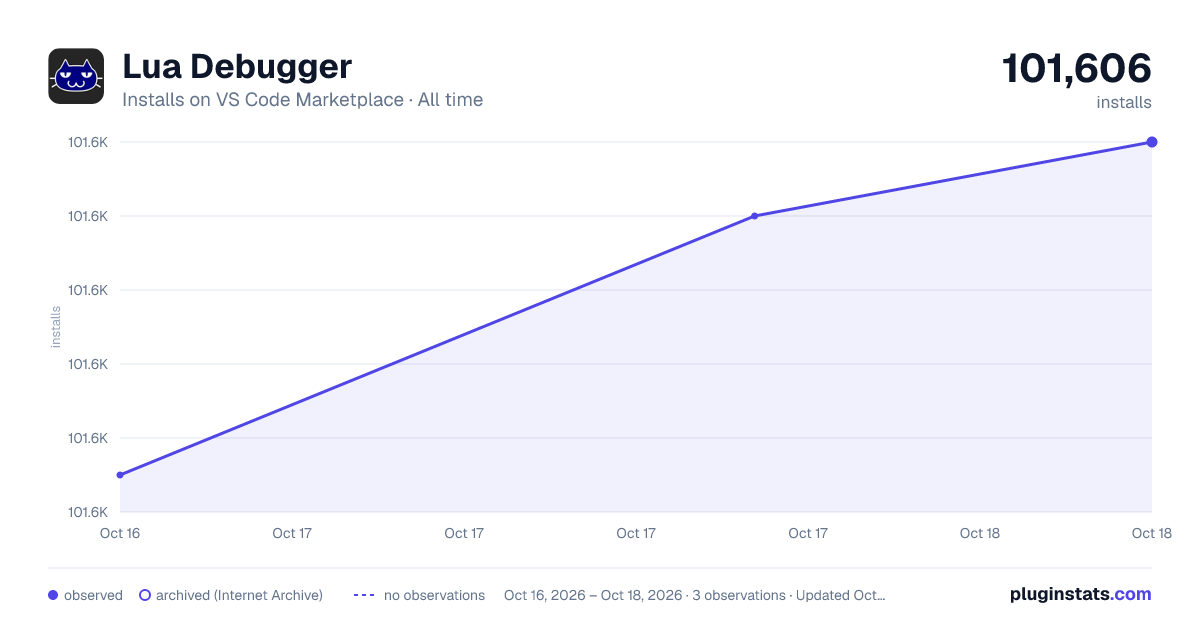
Lua Debugger has 101,606 recorded installs on VS Code Marketplace.
It ranks #2343 of 2,500 tracked VS Code Marketplace listings by installs.
It is rated 4.0 out of 5 from 2 ratings.
PluginStats has 3 daily observations since Oct 16, 2026; the latest is from Oct 18, 2026.
Rating: 4.00 / 5 from 2 ratings
About Lua Debugger
한국어 문서 읽기
Introduction
You can use the Lua Debugger extension to debug Lua programs with Visual Studio Code.
Requirements
• You should be able to use luasocket in a Lua program to be debugged. • You should be able to use a JSON library in a Lua program to be debugged. cjson and dkjson are recommended, but you can use other JSON libraries whose interfaces are compatible. • Your code or third party library should not call debug.sethook.
Configuration
In order to debug Lua programs with Lua Debugger, you have to put vscode-debuggee.lua in the program to be debugged. If you have used mobdebug, you are familiar with it.
Debugger Connection
1. Download vscode-debuggee.lua and put it in your project.
2. Paste the following code into your program to run after all the Lua source code is loaded. Depending on which JSON library you are using, you may need to modify your code accordingly.
3. Open the folder that contains the program you want to debug in Visual Studio Code, open the Debug window with Ctrl-Shift-D, and edit the debugging settings accordingly.
4. Set the breakpoint by pressing F9 at the appropriate location in the program to be debugged.
5. Press the F5 key to start debugging.
Setting to Enter the Debugger When an Error Occurs
Paste the following code at the location where you want to handle the error.
Enabling Debug Commands to be Processed During Execution
To enable the Lua program to respond to commands from the debugger, such as setting a pause or a breakpoint, while running, set the following code to be called at appropriate intervals.
If your project is a game client, you can call it every frame.
Gideros Support
You can run Gideros Player directly from Visual Studio Code. Please refer to the 'launch-gideros' section of the debugging settings.
Remote Debugging
If you set the debugging setting to wait and start debugging, Visual Studio Code will wait for a debuggee without executing one. This is useful if you want to see the string that the debugging target leaves on the console, or if the debugger and the debugging target must be running on different machines.
OP_HALT Patch
Basically Vscode-debuggee.lua drops the speed of running Lua programs because it implements the breakpoint mechanism using debug.sethook. This performance degradation can be overcome by applying a simple patch to the Lua VM.
Download: • lua 5.1.5 : Patch, Code • lua 5.3.4 : Patch, Code
Acknowledgments
• The OP_HALT patch relies heavily on the work mentioned in the Lua mailing list. Thanks to Dan Tull. • We got an idea from mobdebug about how to connect the debuggee to the debugger. Thanks to Paul Kulchenko. • Thanks to Google Translator for translating this article!
vscode-debuggee.lua Reference
debuggee.start(jsonLib, config)
Connect with the debugger. jsonLib is a JSON library containing .encode and .decode functions. Config.onError is a callback to receive when an error occurs in the vscode-debuggee module. Config.connectTimeout, config.controllerHost, and config.controllerPort are settings for remote debugging. If config.redirectPrint is true, the print call is intercepted and displayed in the Visual Studio Code output window. Use this item if you want Gideros to print the results of a print called just before the breakpoint.
debuggee.start returns two values. The first return value is true if it is normally connected to the debugger, otherwise it is false. If the OP_HALT patch is applied in the current Lua VM, the second return value is 'halt', otherwise it is 'pure'.
debuggee.poll()
Processes queued debugging commands and returns immediately.
debuggee.enterDebugLoop(depth[, what])
Stops running the Lua program and start debugging from the current location. depth specifies the relative depth of the stack to indicate where the debugger is currently running. 0 means the place to call debuggee.enterDebugLoop, and 1 means a step shallow. what is the message you want to pass to the Visual Studio Code as you start debugging.
debuggee.print(category, ...)
Prints text on vscode debug console. category colorize print text, you can choose log, warning, or error.
Description from the VS Code Marketplace listing.
- debuggers
Where Lua Debugger sits in the listing
Each band is one page of 20. Installs on a log scale. Placement is projected from installs, so it can differ from the marketplace's own sort order. Hover a dot to see the listing.


Charts
Images: 30d · 1y · all time · 1600×900 dark


Adoption over time


7/30/90-day growth


Ranking history


Filled points are observed values; hollow points come from Internet Archive snapshots of the listing page. Dashed segments span periods with no observations — values between points are not interpolated.
Recent observations
Full history (3)Similar VS Code Marketplace Debuggers plugins
Data source
Install counts, average rating, and rating counts come from the public Visual Studio Marketplace gallery API. Installs are cumulative and exclude updates.
Listing: https://marketplace.visualstudio.com/items?itemName=devCAT.lua-debug. First seen Oct 16, 2026; last successful collection Oct 18, 2026. See the methodology.