 PluginStats
Flame Chart Visualizer for JavaScript Profiles installs statistics
By Microsoft (223 listings) · VS Code Marketplace · Other
Flame graph visualizer for Heap and CPU profiles taken from the JavaScript debugger
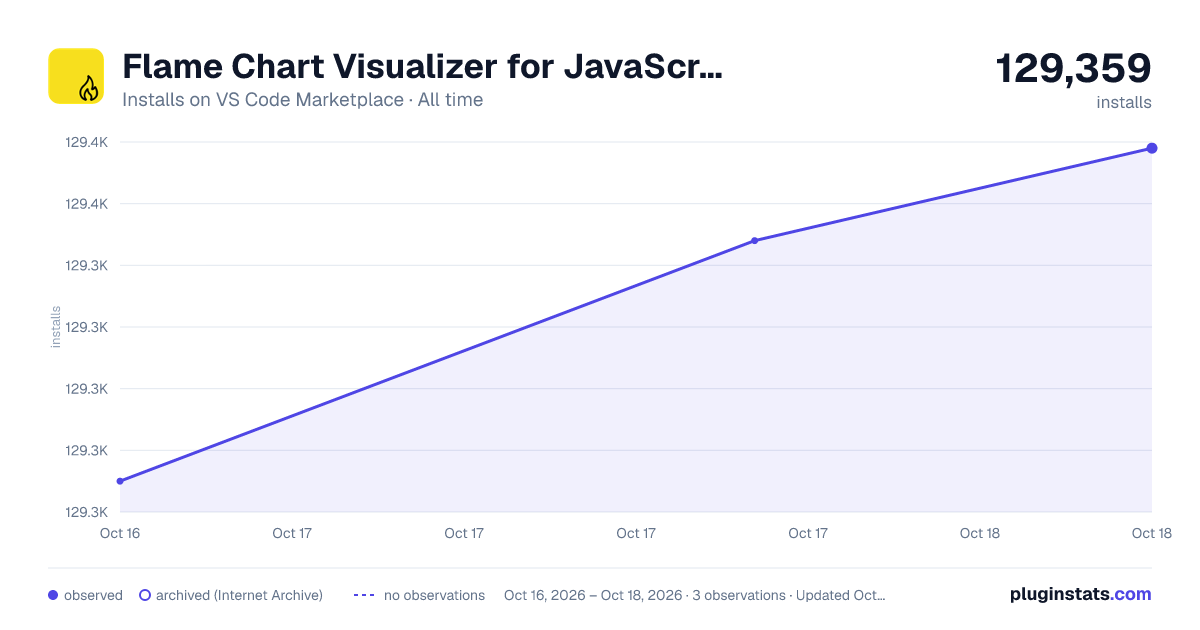
Flame Chart Visualizer for JavaScript Profiles has 129,359 recorded installs on VS Code Marketplace.
It ranks #2033 of 2,500 tracked VS Code Marketplace listings by installs.
It is rated 3.7 out of 5 from 11 ratings.
PluginStats has 3 daily observations since Oct 16, 2026; the latest is from Oct 18, 2026.
Rating: 3.73 / 5 from 11 ratings
About Flame Chart Visualizer for JavaScript Profiles
vscode-js-profile-flame
This package contains two pieces of functionality: a flame chart viewer for V8-style .cpuprofile files, and a realtime performance view for VS Code:
Realtime Performance View
While running or debugging a JavaScript debug target (a launch type of node, chrome, msedge, extensionHost, or their pwa- prefixed versions), the realtime performance view is show in the Debug view:
For Node.js, CPU and heap usage is shown. For browsers, we additionally show DOM node count, restyles per second, and relayouts per second. Clocking on the labels on the bottom will expand a view that lets you show or hide different series.
You can click the "split" button in the view title to show each series on its own chart, and there's also a button to quickly take a profile of the running program.
You can further configure the realtime performance view with the following user settings:
• debug.flameGraph.realtimePollInterval: How often (in seconds) to refresh statistics from the runtime. • debug.flameGraph.realtimeViewDuration: How much time (in seconds) should be kept in the graph. • debug.flameGraph.realtimeEasing: Whether easing is enabled on the realtime graph.
Flame Chart View
You can open a .cpuprofile or .heapprofile file (such as one taken by clicking the "profile" button in the realtime performance view), then click the 🔥 button in the upper right to open a flame chart view.
By default, this view shows chronological "snapshots" of your program's stack taken roughly each millisecond. You can zoom and explore the flamechart, and ctrl or cmd+click on stacks to jump to the stack location.
The flame chart also supports a "left heavy" view, toggled by clicking the button in the upper-right corner of the chart.
This view groups call stacks and orders them by time, creating a visual representation of the "top down" table you might have used in other tools. This is especially useful if your profile has lots of thin call stacks (common with things like web servers) which are hard to get a sense of in the chronological view. Here's the left-heavy view of the same profile:
The flame chart color is tweakable via the charts-red color token in your VS Code theme.
Memory Graph View
You can open a .heapsnapshot file in VS Code and click on the "graph" icon beside an object in memory to view a chart of its retainers:
Description from the VS Code Marketplace listing.
- javascript
Where Flame Chart Visualizer for JavaScript Profiles sits in the listing
Each band is one page of 20. Installs on a log scale. Placement is projected from installs, so it can differ from the marketplace's own sort order. Hover a dot to see the listing.


Charts
Images: 30d · 1y · all time · 1600×900 dark



Adoption over time


7/30/90-day growth


Ranking history


Filled points are observed values; hollow points come from Internet Archive snapshots of the listing page. Dashed segments span periods with no observations — values between points are not interpolated.
Recent observations
Full history (3)Similar VS Code Marketplace Other plugins
Data source
Install counts, average rating, and rating counts come from the public Visual Studio Marketplace gallery API. Installs are cumulative and exclude updates.
Listing: https://marketplace.visualstudio.com/items?itemName=ms-vscode.vscode-js-profile-flame. First seen Oct 16, 2026; last successful collection Oct 18, 2026. See the methodology.